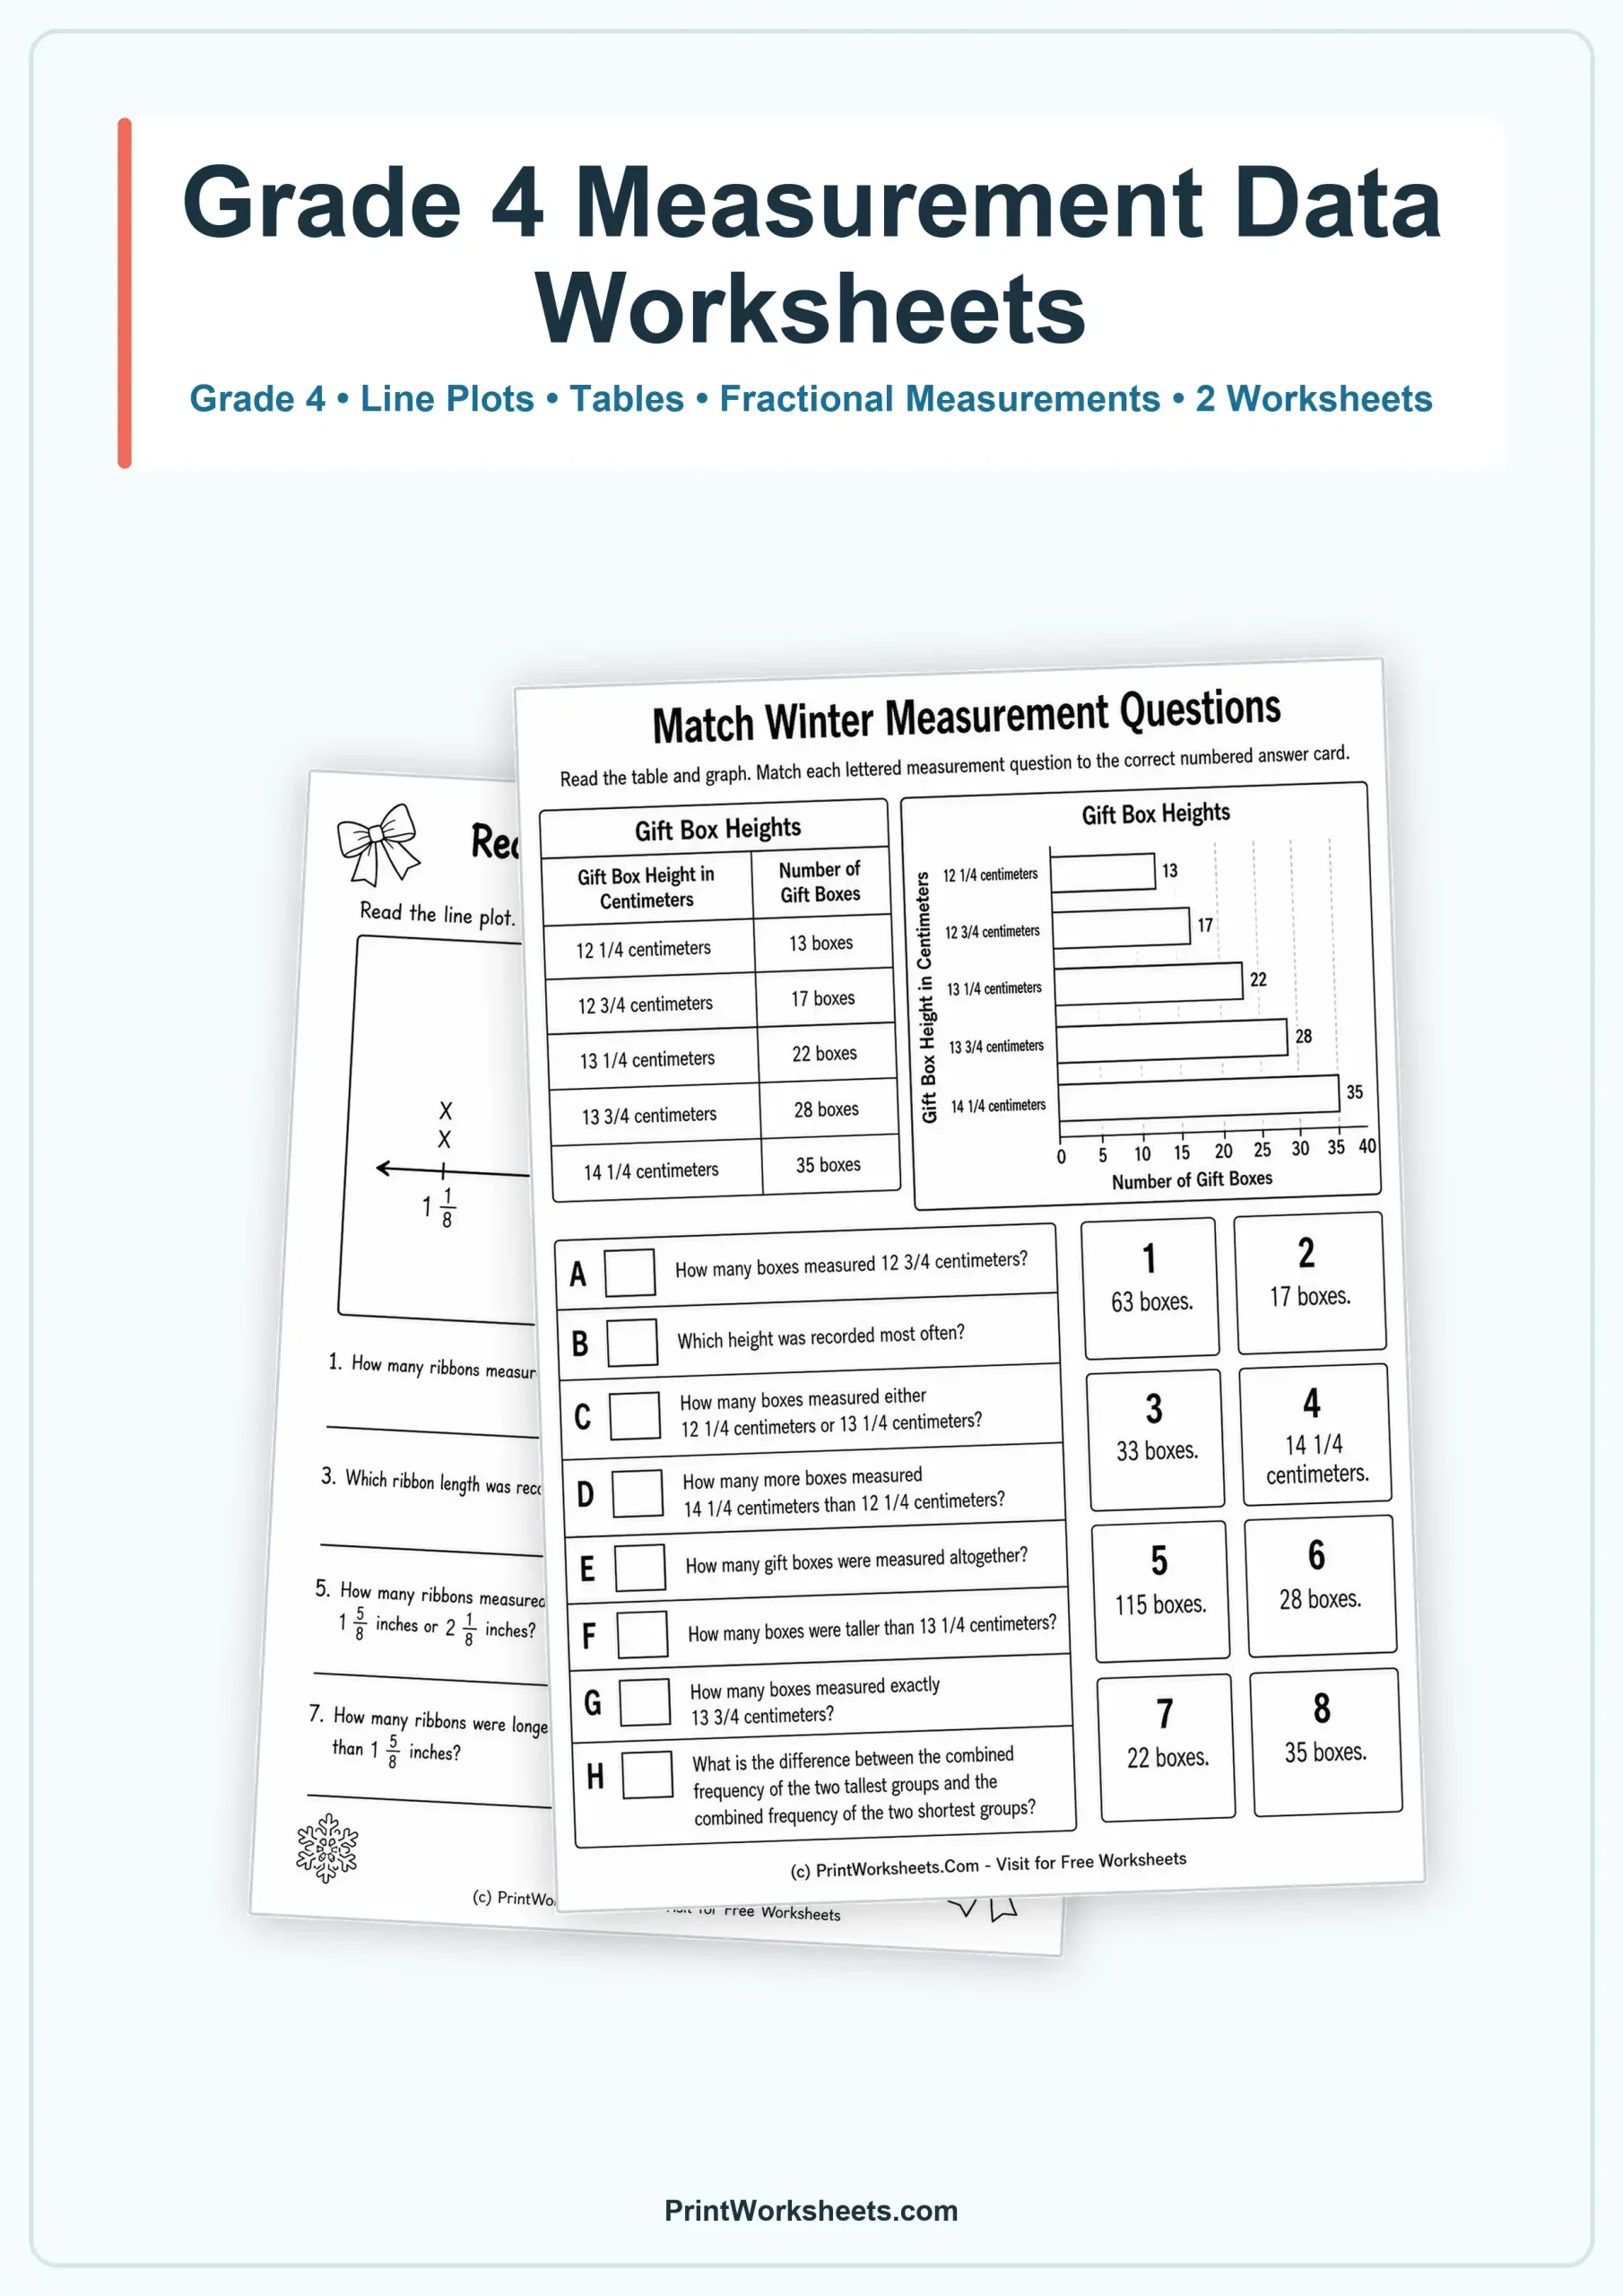
These Grade 4 measurement data worksheets give students practice reading fractional measurements, interpreting frequency displays, and using the data to solve multi-step questions. The two printable activities move beyond simple graph reading by asking students to compare groups, combine frequencies, find differences, and connect mixed-number measurements to real situations involving ribbons and gift boxes. Because the values include eighth-inch and quarter-centimeter increments, the set is especially useful when students are ready to apply fraction understanding inside measurement and data problems.
Measurement Data Worksheets with Fractional Values
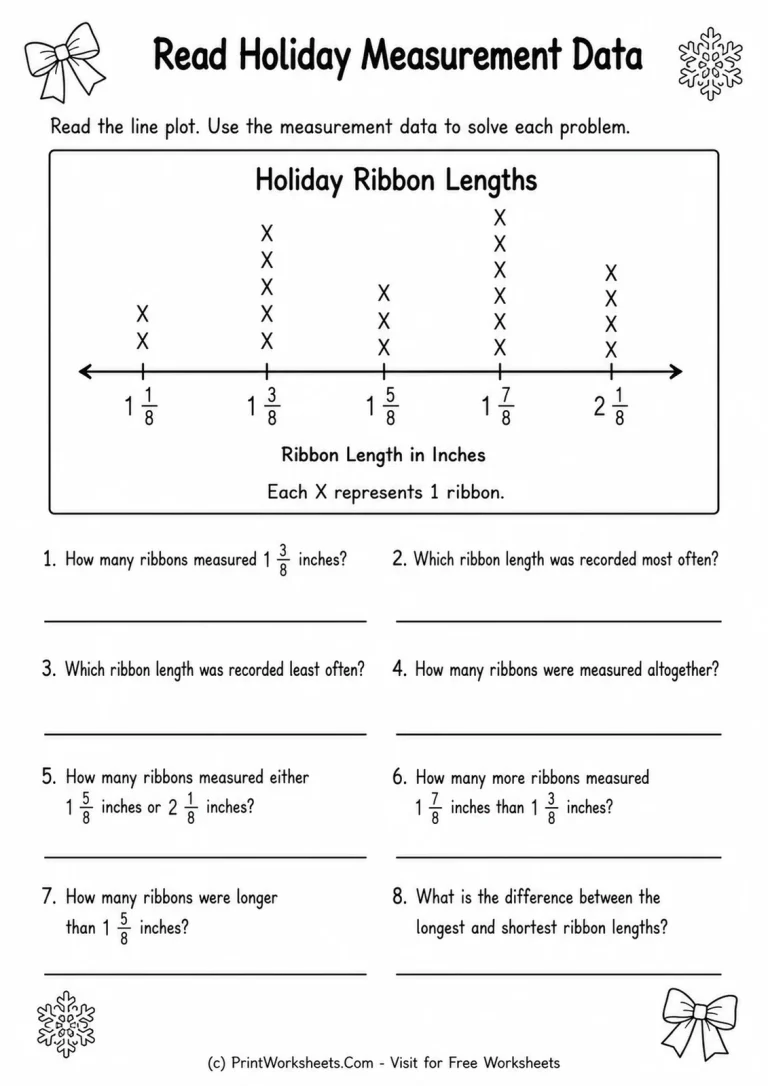
The first worksheet centers on a holiday ribbon line plot. Ribbon lengths are marked at 1 1/8, 1 3/8, 1 5/8, 1 7/8, and 2 1/8 inches, with each X representing one ribbon. Students must read the frequency at each measurement and then use those counts to answer eight questions. The questions include finding how many ribbons have a specific length, identifying the most and least frequent lengths, finding the total number of ribbons, combining two categories, comparing two frequencies, counting values above a threshold, and calculating the difference between the longest and shortest recorded lengths.
Read and Reason from a Line Plot
This page gives Grade 4 students a useful combination of visual data interpretation and fraction reasoning. Instead of treating the line plot as a picture to copy, students must translate marks into quantities and then decide which operation fits each question. For example, one item asks how many ribbons are longer than 1 5/8 inches, so students need to identify the relevant categories before combining their frequencies. Another asks for the difference between the longest and shortest ribbon lengths, which requires attention to the measurement scale rather than the number of data points.
Compare a Table and Bar Graph
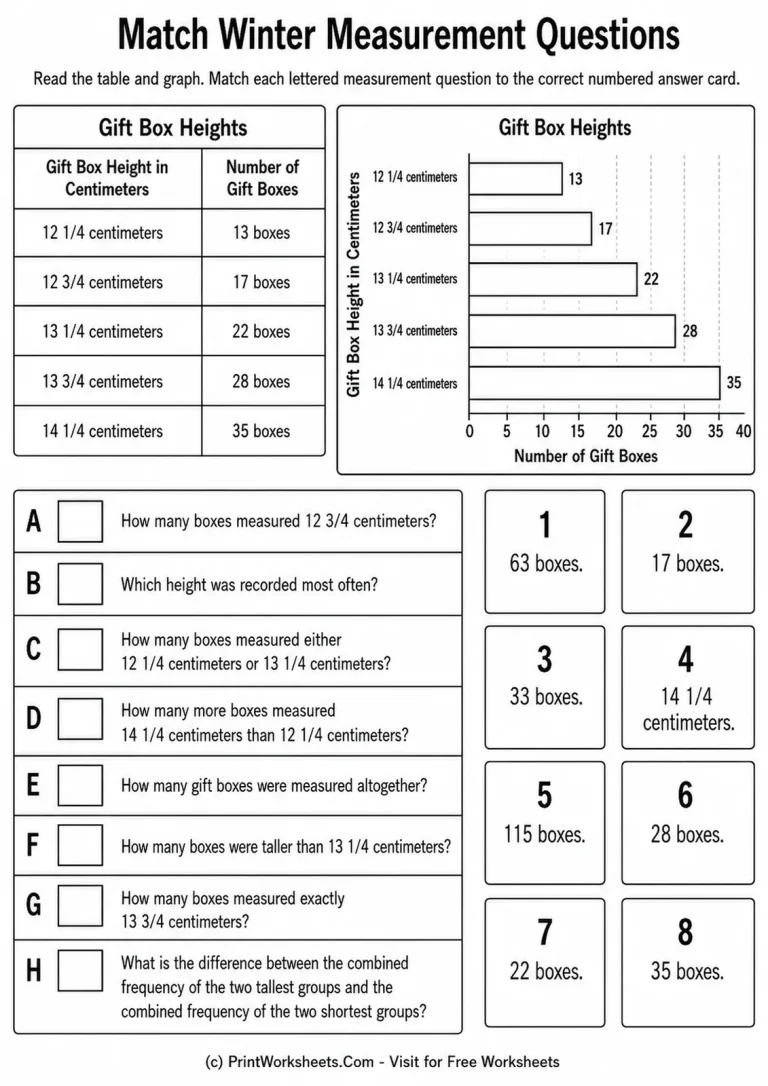
The second worksheet presents gift box heights in both a table and a horizontal bar graph. The measurements are 12 1/4, 12 3/4, 13 1/4, 13 3/4, and 14 1/4 centimeters, paired with frequencies of 13, 17, 22, 28, and 35 gift boxes. Students match eight lettered questions to eight numbered answer cards. This format adds a different kind of reasoning: learners must locate information in two equivalent data displays, calculate when necessary, and then verify that their result matches a unique answer choice.
The matching questions include direct retrieval, combined totals, frequency differences, identifying the most common height, finding the total number measured, and comparing the combined frequency of the two tallest groups with the two shortest groups. One problem, for example, requires students to compare 28 + 35 with 13 + 17. That makes the worksheet useful for practicing multi-step data analysis without introducing an unfamiliar graph type.
Skills Practiced in These Grade 4 Measurement Problems
Together, the worksheets reinforce several connected fourth-grade skills: reading line plots, interpreting tables and bar graphs, working with mixed-number measurements, adding and subtracting frequencies, comparing categories, and answering questions from data rather than from isolated equations. The holiday context keeps the numbers grounded in concrete objects, while the mathematical work remains focused on measurement and data.
These pages can fit a measurement unit, a data and graphing lesson, fraction review, math centers, homework, or a short assessment. A teacher can also ask students to explain how they know which data points belong in a combined total. That extra verbal step is helpful because it checks whether students understand the question structure instead of simply performing arithmetic on every number they see.
Extend the Practice with Related Word Problems
If students need another application of measurement reasoning, the area and perimeter word problems worksheets provide a useful bridge from reading measurements to solving geometry-based situations. For learners who benefit from slightly easier seasonal story problems before returning to fourth-grade data work, try the fall math word problems. Another seasonal option is the Labor Day math word problems worksheets, which can give younger or less-confident students additional practice turning short situations into calculations.
A Focused Printable Set for Measurement and Data
What makes this set useful is the change in representation between the two pages. Students first interpret a line plot with eighth-inch intervals, then work with a table and bar graph containing quarter-centimeter measurements. The tasks progress from straightforward frequency reading to combined groups and differences, so the worksheets can reveal whether a student can use data flexibly rather than only identify a single bar or mark. Print the pages for focused Grade 4 practice when you want measurement, fractions, graphs, and word-problem reasoning working together in the same lesson.