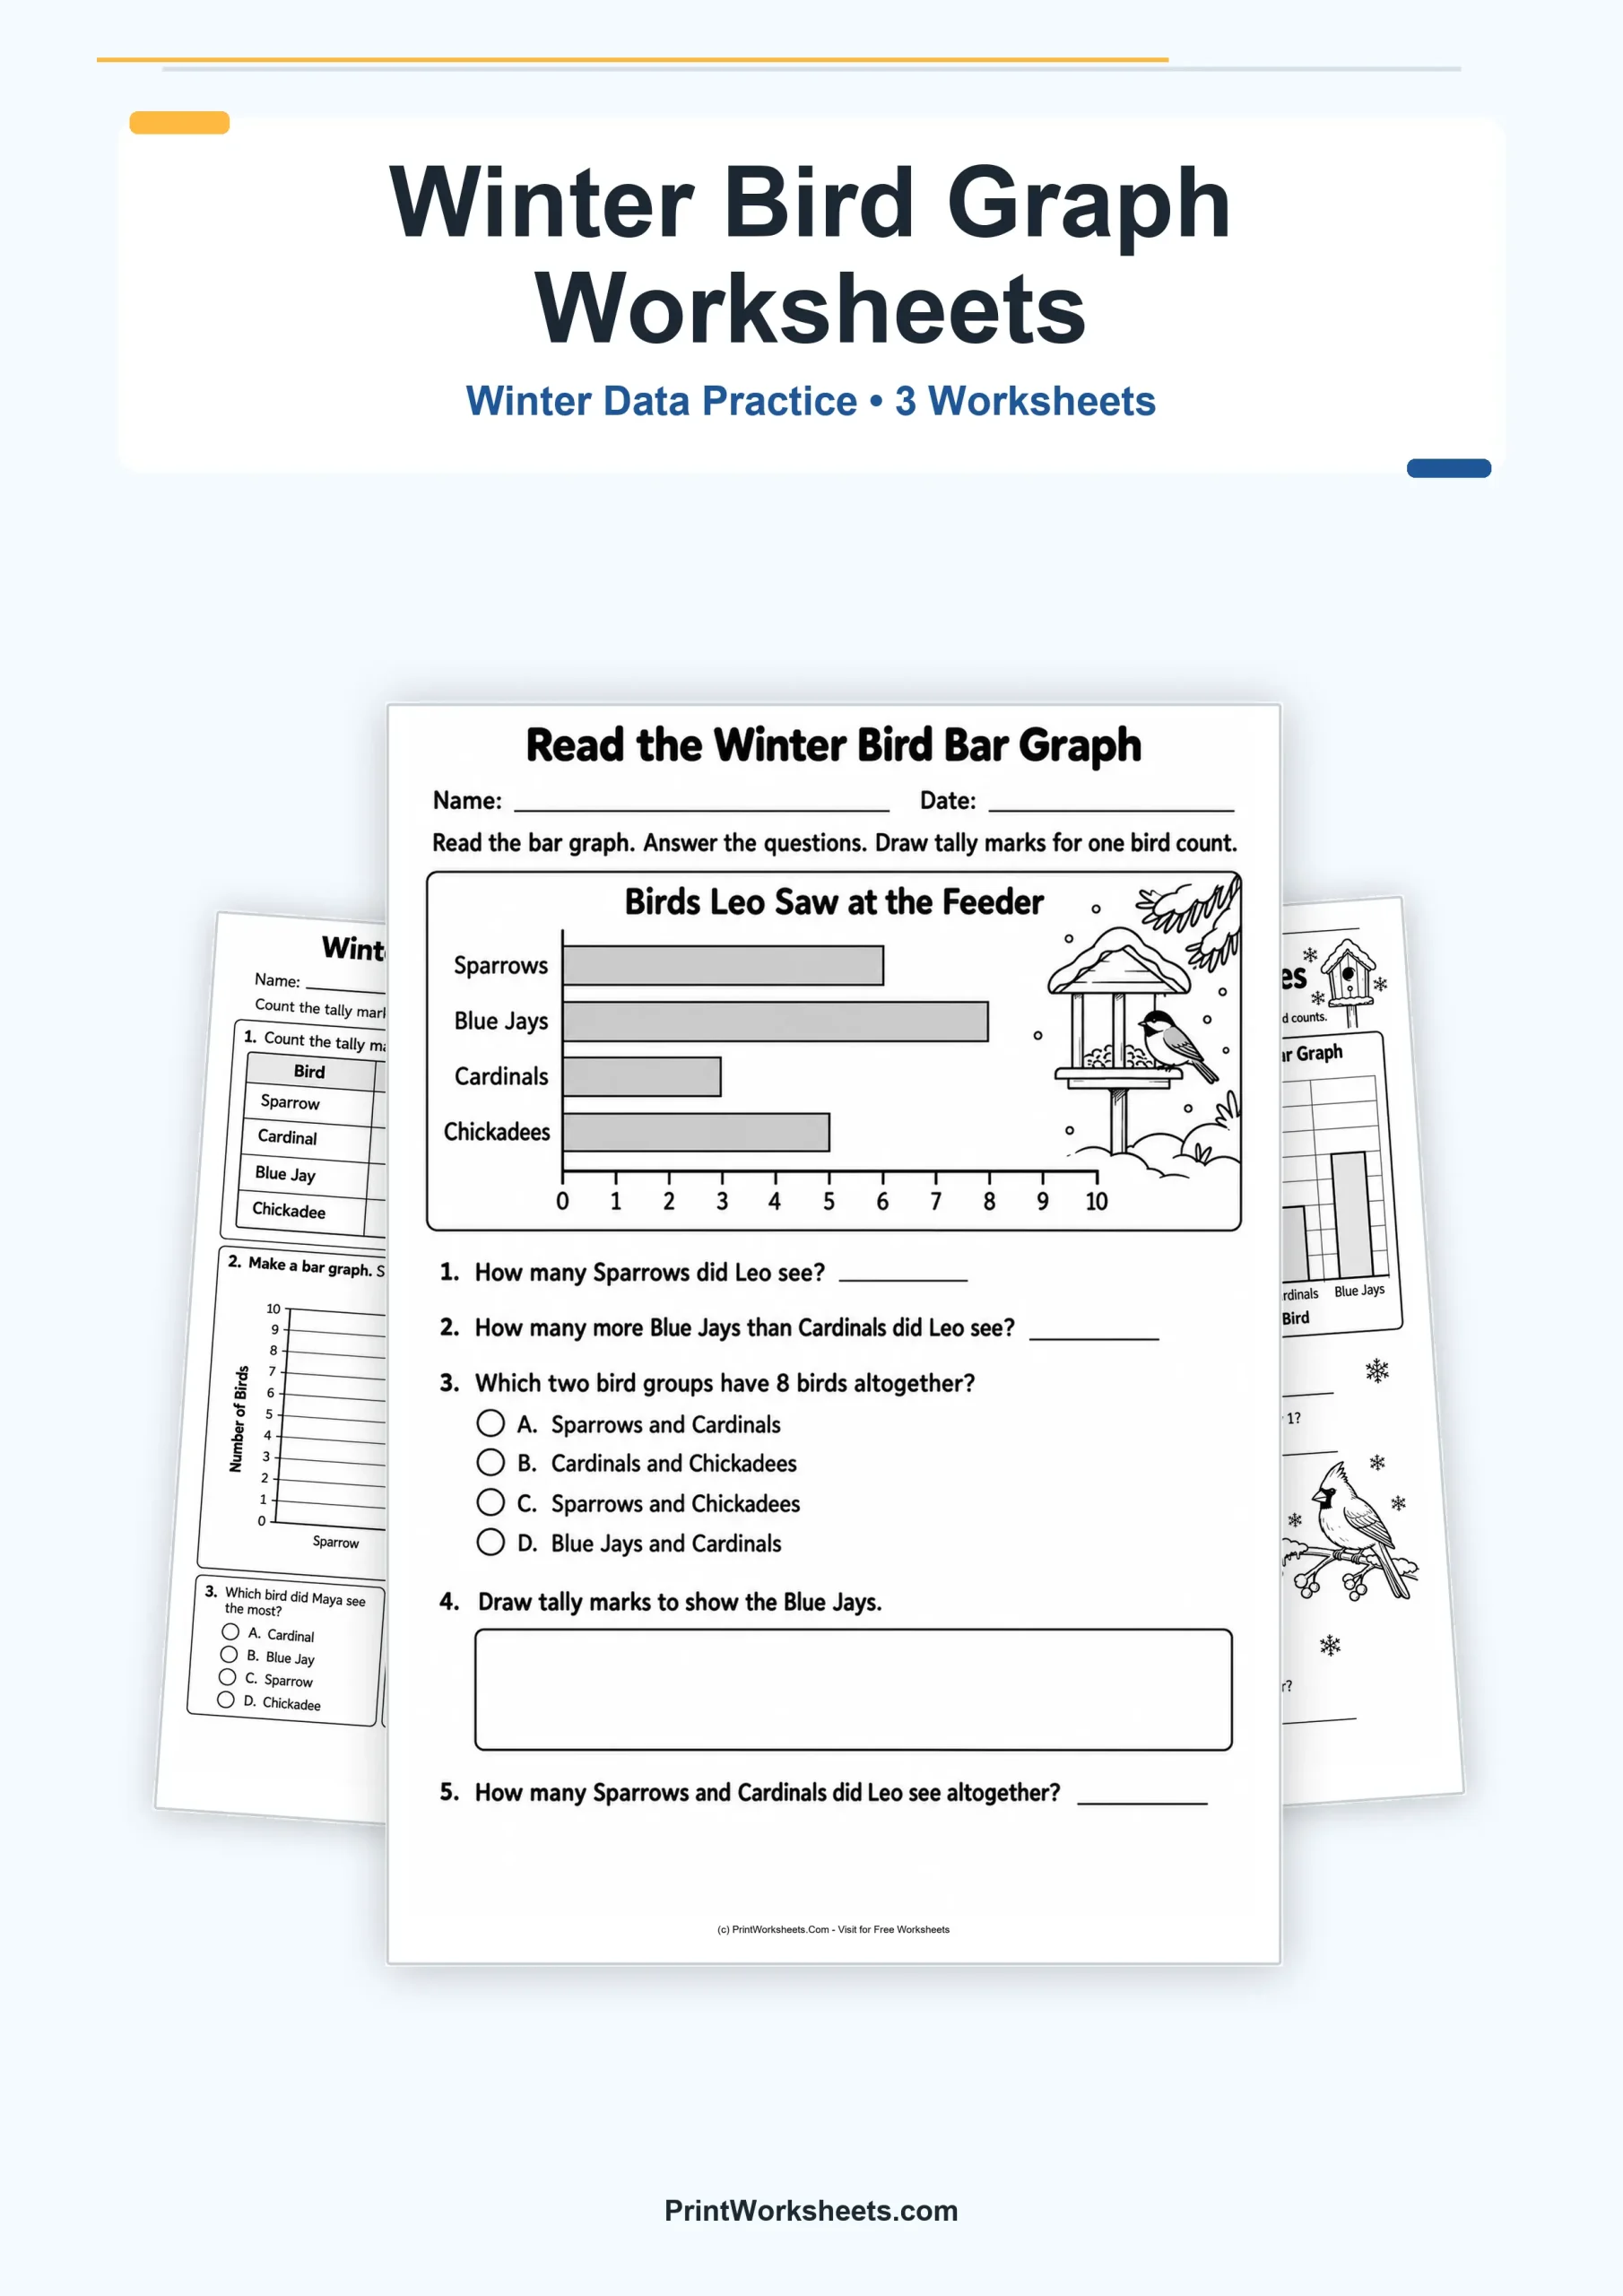
These bird graph worksheets turn a winter birdwatch theme into focused practice with tally marks, tables, bar graphs, addition, and comparison. Students work with familiar bird categories such as sparrows, cardinals, blue jays, and chickadees while moving between different ways of representing the same kind of data. Instead of only reading a finished graph, the activities ask children to count observations, record numerical values, build a graph, interpret existing graphs, and compare information collected on different days.
Bird Graph Worksheets for Tally Marks and Bar Graphs
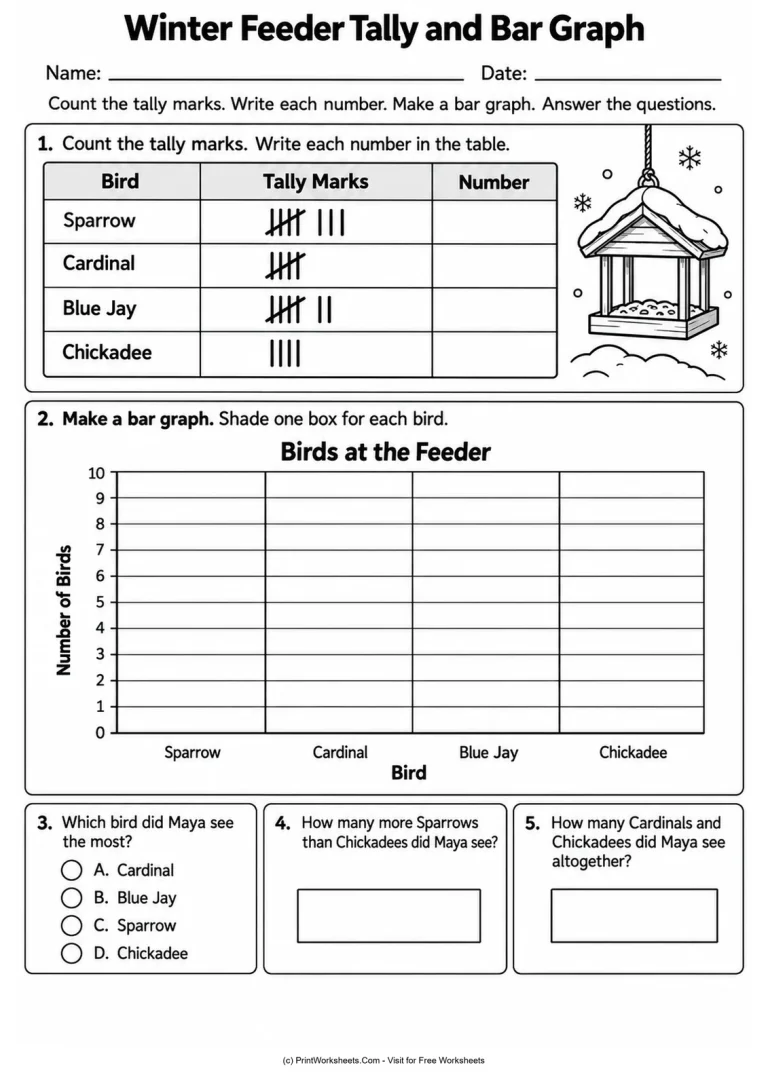
The first activity begins with a tally chart showing four types of birds at a winter feeder. Students count each group of tally marks and write the matching number in the table. The visible data gives them several different quantities to interpret, including a group of eight sparrows, five cardinals, seven blue jays, and four chickadees. After recording the numbers, students transfer those values to a vertical bar graph with a scale from 0 to 10.
This sequence is useful because students must connect three representations of data: tally marks, written numbers, and bars on a graph. The follow-up questions then ask them to identify the bird seen most often, compare two bird counts, and combine categories. Children are not simply copying values; they have to understand what each number means in the context of the birdwatch.
Read and Interpret a Winter Bird Bar Graph
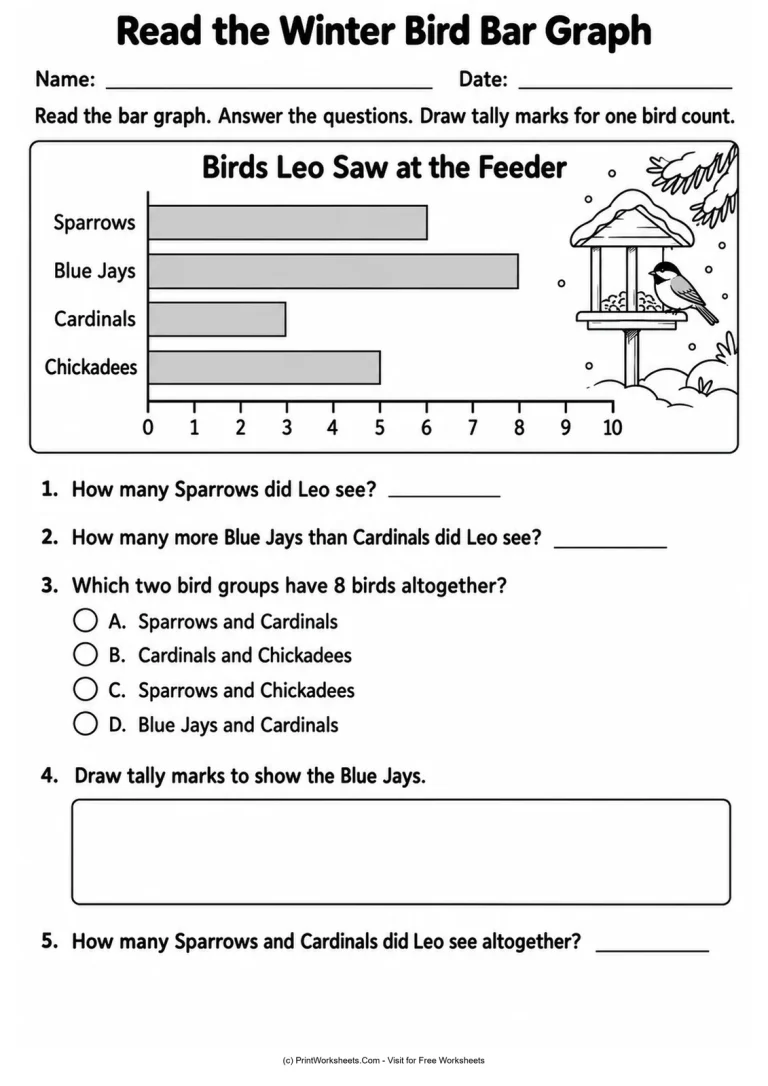
Another worksheet reverses the process by giving students a completed horizontal bar graph. The graph shows sparrows, blue jays, cardinals, and chickadees on a clear 0-to-10 number line. Students read exact values from the bars and use those values to answer questions.
The questions extend beyond basic graph reading. Students find how many more blue jays were observed than cardinals, identify two bird groups that combine to make a given total, and add sparrows and cardinals together. One task also asks students to draw tally marks representing the blue jay count. That connection between graph data and tally notation reinforces the idea that one quantity can be represented in more than one mathematical form.
Compare Birdwatch Data Across Two Days
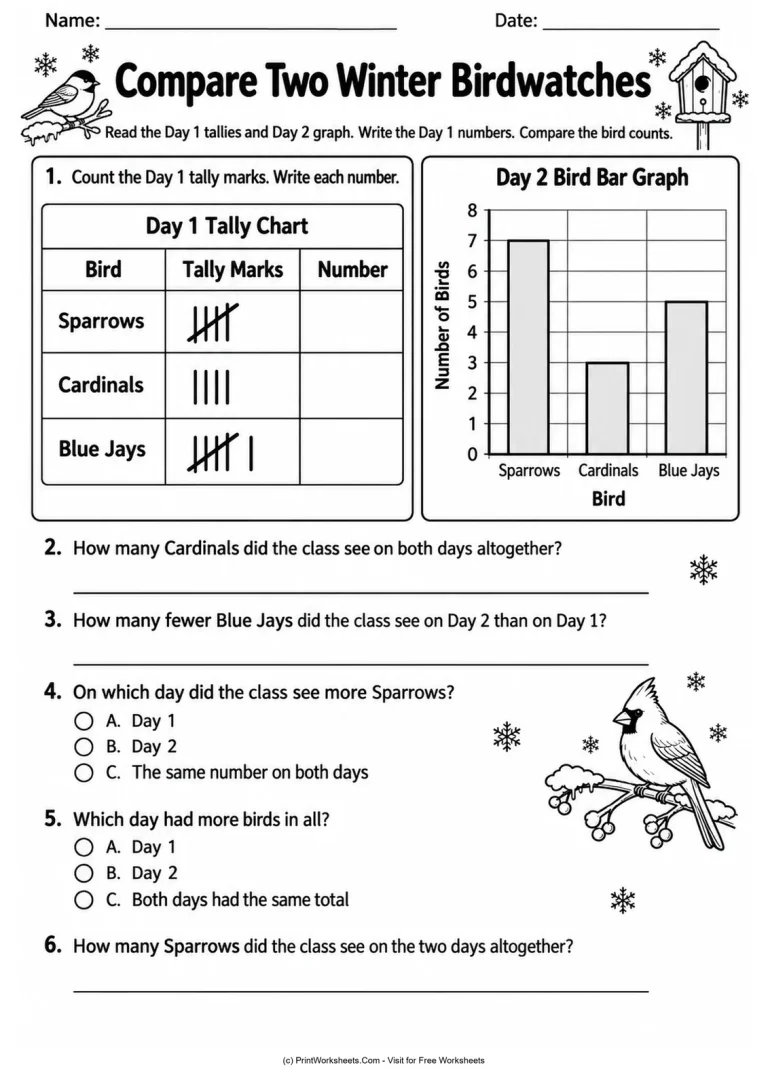
The most advanced activity combines a Day 1 tally chart with a Day 2 bar graph. Students first convert the Day 1 tallies into numbers for sparrows, cardinals, and blue jays. They then read the Day 2 graph and compare the two sets of observations.
This page introduces several useful data questions. Students combine cardinal counts from both days, determine how many fewer blue jays were seen on one day, decide which day had more sparrows, and compare the total number of birds observed each day. The data is especially helpful for discussion because the individual categories change even though the overall totals for the two days are the same. Students can see that equal totals do not require every category to have equal values.
Skills Practiced in the Birdwatch Activities
Across the set, students practice counting tally marks accurately, matching tallies to numerals, reading horizontal and vertical bar graphs, using graph scales, adding category totals, finding differences, and comparing two collections of data. The winter feeder theme gives those skills a concrete context without making the mathematics dependent on background knowledge about birds.
The activities fit well with early elementary graphing and data lessons because the numbers stay within a manageable range while the questions gradually require more reasoning. A student can begin by counting marks one group at a time, then progress to interpreting a finished graph, and finally compare information presented in two different formats.
Ways to Use These Winter Data Worksheets
Teachers can use the pages during a graphing unit, winter math center, independent practice period, or small-group lesson. The tally-to-graph activity works well when students are learning how raw counts become a visual display. The completed bar graph activity is useful for checking whether students can locate values and answer questions from data. The two-day birdwatch comparison provides an additional challenge for students who are ready to combine and compare information across separate data sets.
Families can also use the worksheets for extra practice with early data skills. After completing the printable activities, children could conduct a simple observation of birds, toys, colors, weather conditions, or another familiar category and make their own tally chart. Creating a small real-world data set helps reinforce the same process shown in the worksheets: observe, count, record, graph, and compare.
This printable set brings those steps together in a consistent winter birdwatch context, giving students repeated practice with the same core concepts while changing the way the information is presented and the type of reasoning each question requires.