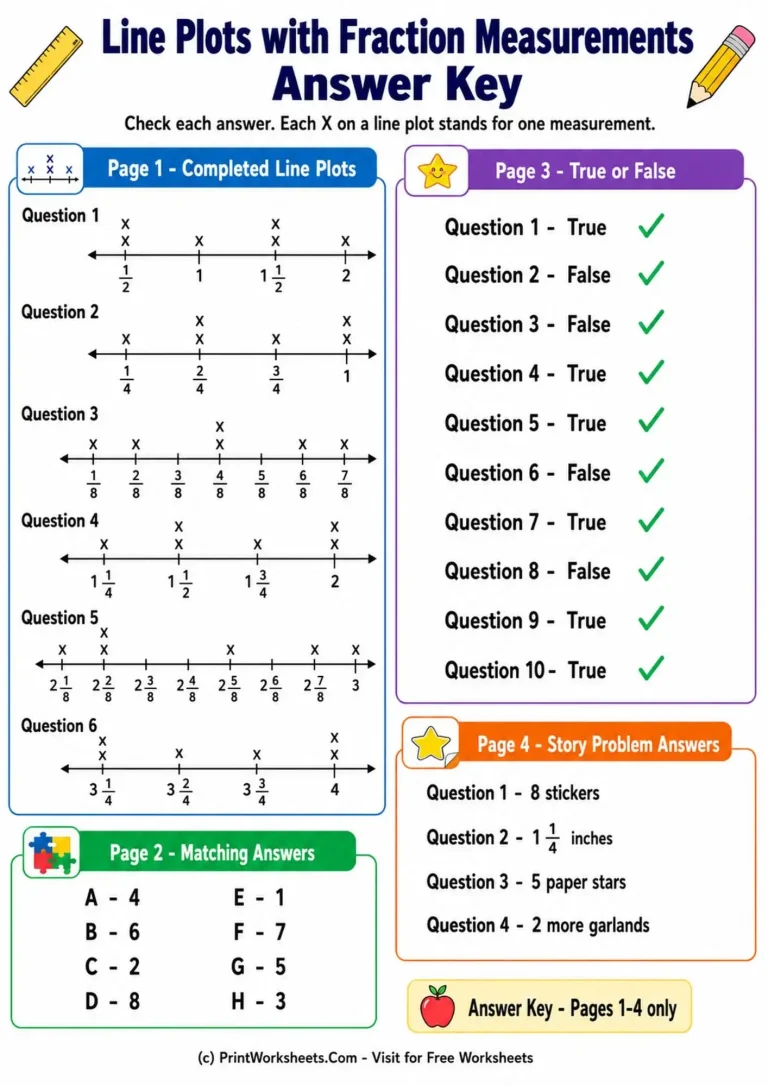
Interpreting data is a massive part of the 4th-grade math curriculum. While most students are comfortable reading bar graphs with whole numbers, asking them to analyze fractional data introduces a whole new layer of complexity. They have to correctly identify the tick marks on the axis while simultaneously remembering that each ‘X’ represents a separate data point. We created these line plots with fraction measurements worksheets for grade 4 to systematically guide students through plotting, reading, and analyzing this specific type of graph.
If your students are struggling to figure out what the tick marks on the bottom of the plots represent (fourths, eighths, halves, etc.), you might want to quickly review placing unit fractions on number lines before jumping into these heavy data analysis activities.
Included Data Analysis Activities
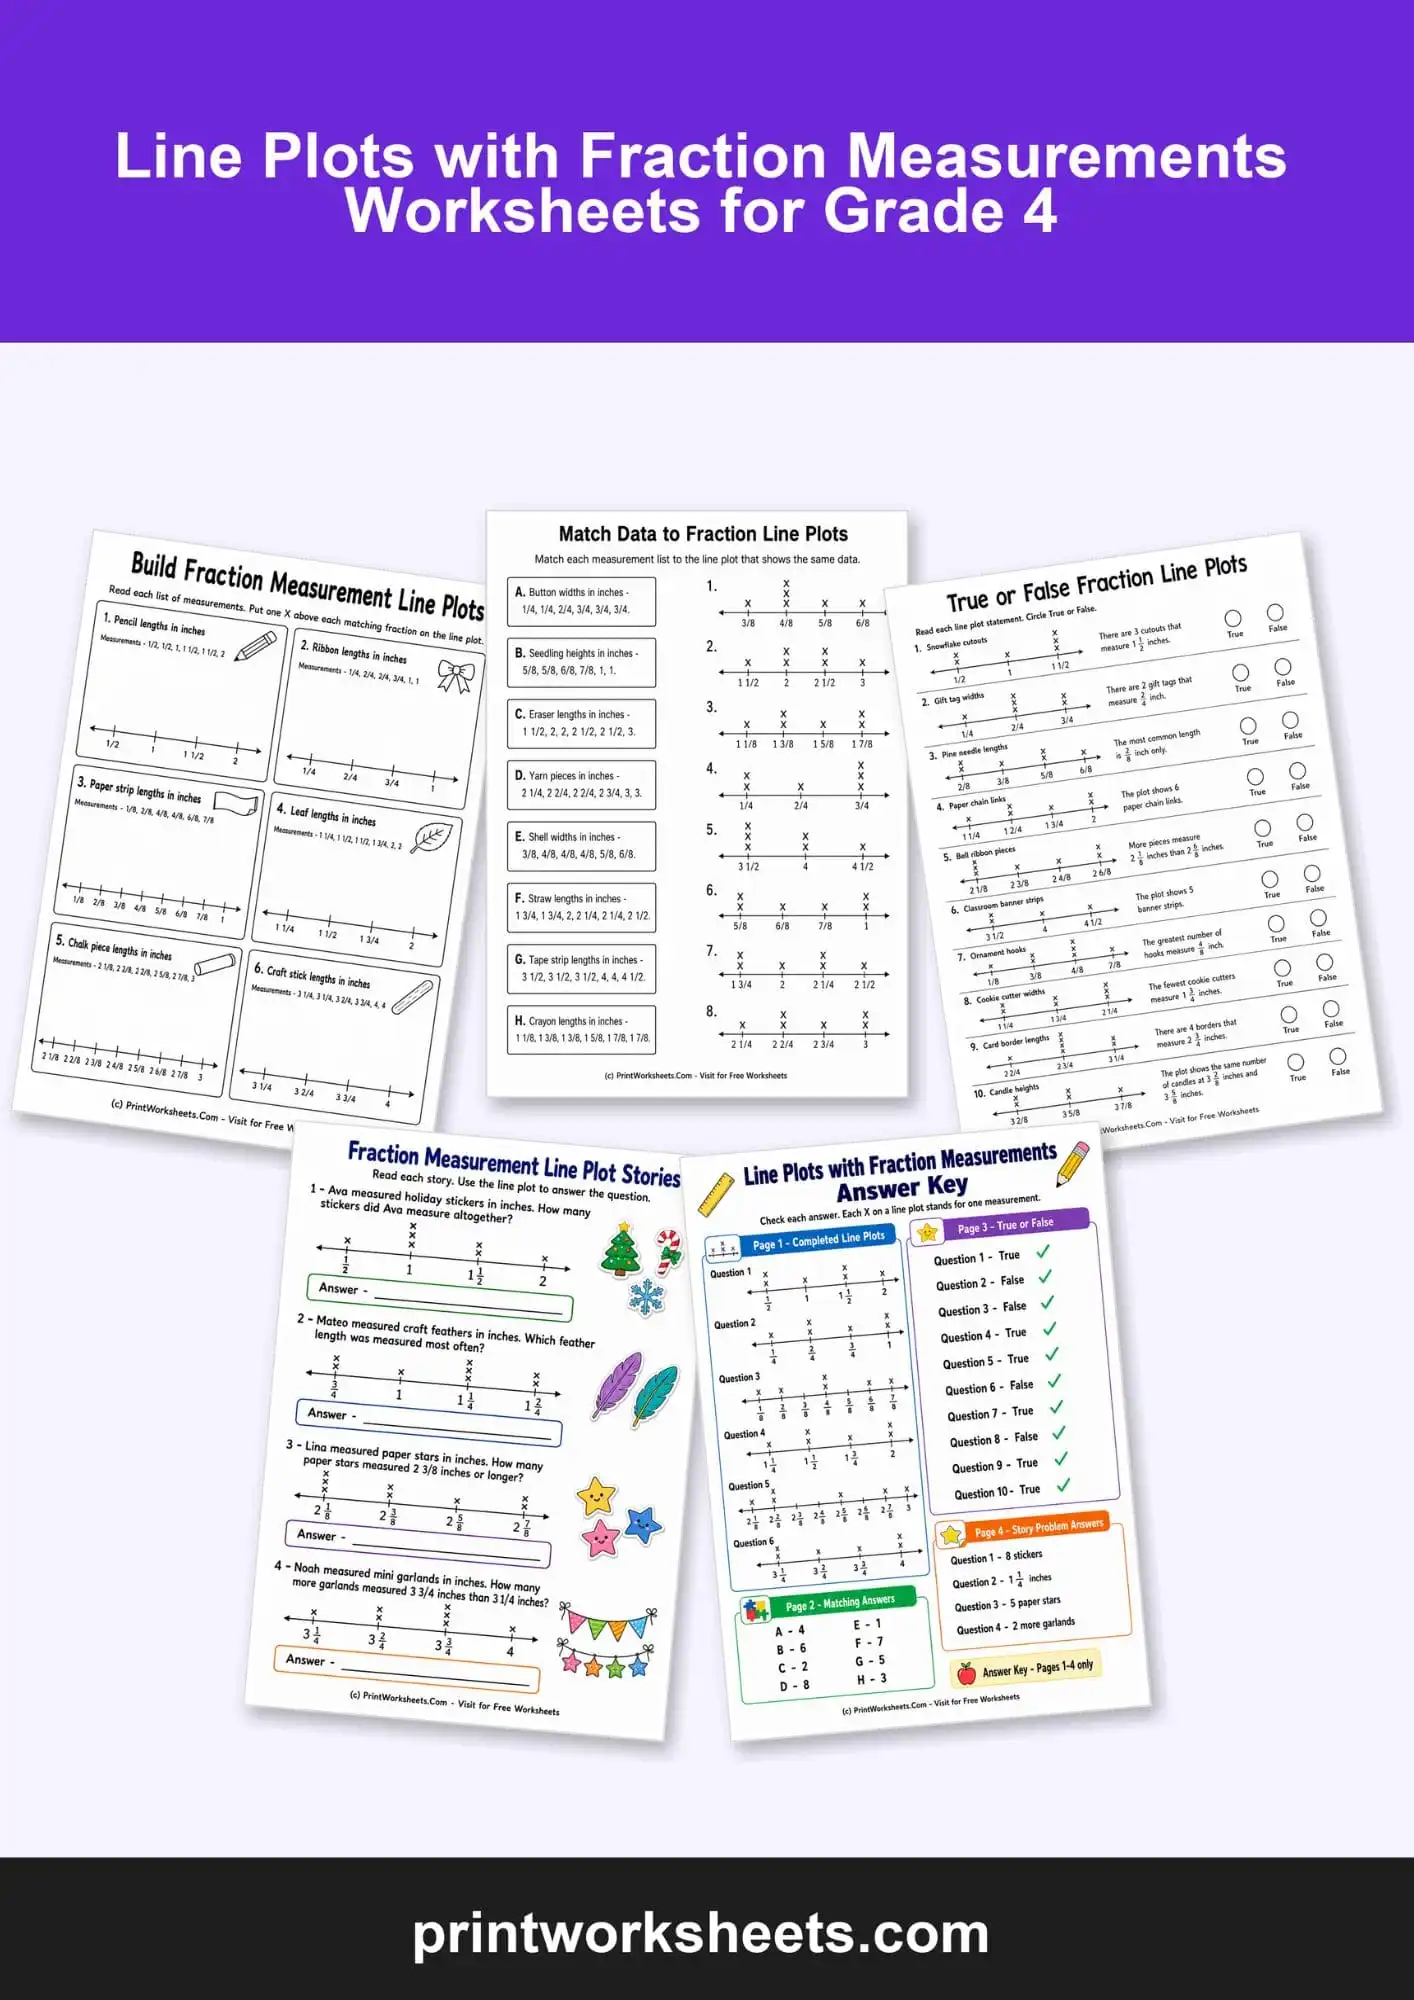
This four-page packet builds data literacy step-by-step. Instead of just throwing students into word problems immediately, we structured the pages to build foundational graph-reading skills first:
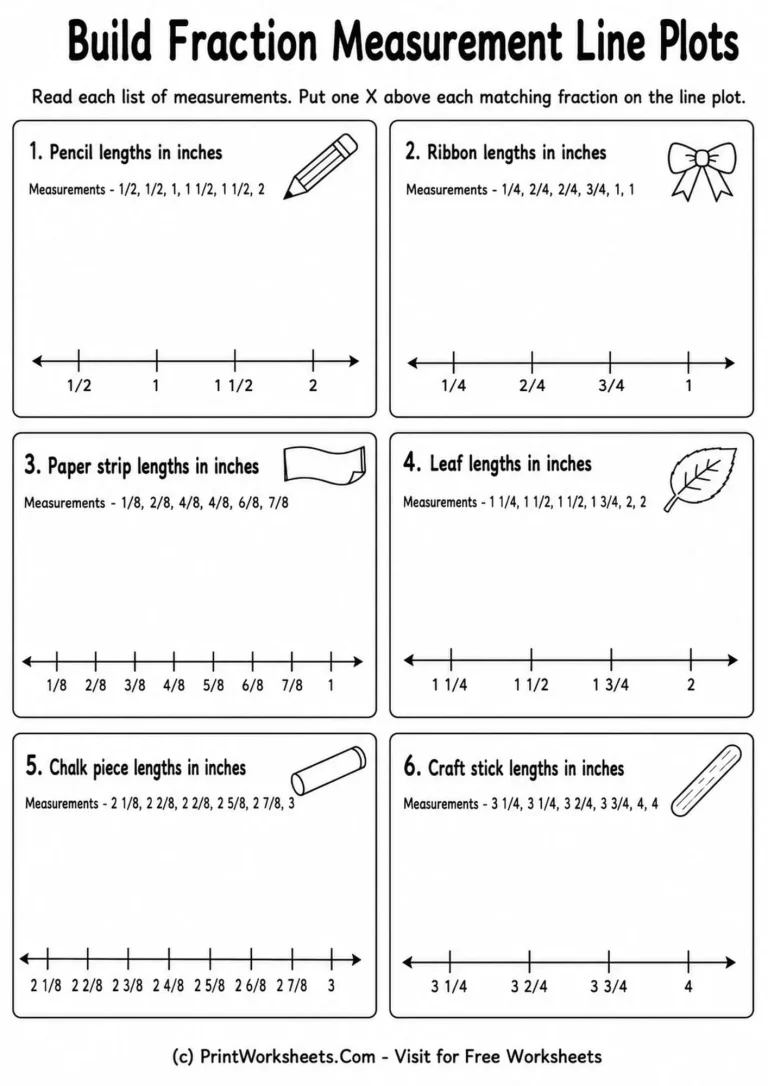
- Build Fraction Measurement Line Plots: Students are given lists of raw measurements (like pencil lengths in inches) and must plot each piece of data with an ‘X’ on a pre-labeled number line. This builds the physical connection between raw numbers and visual graphs.
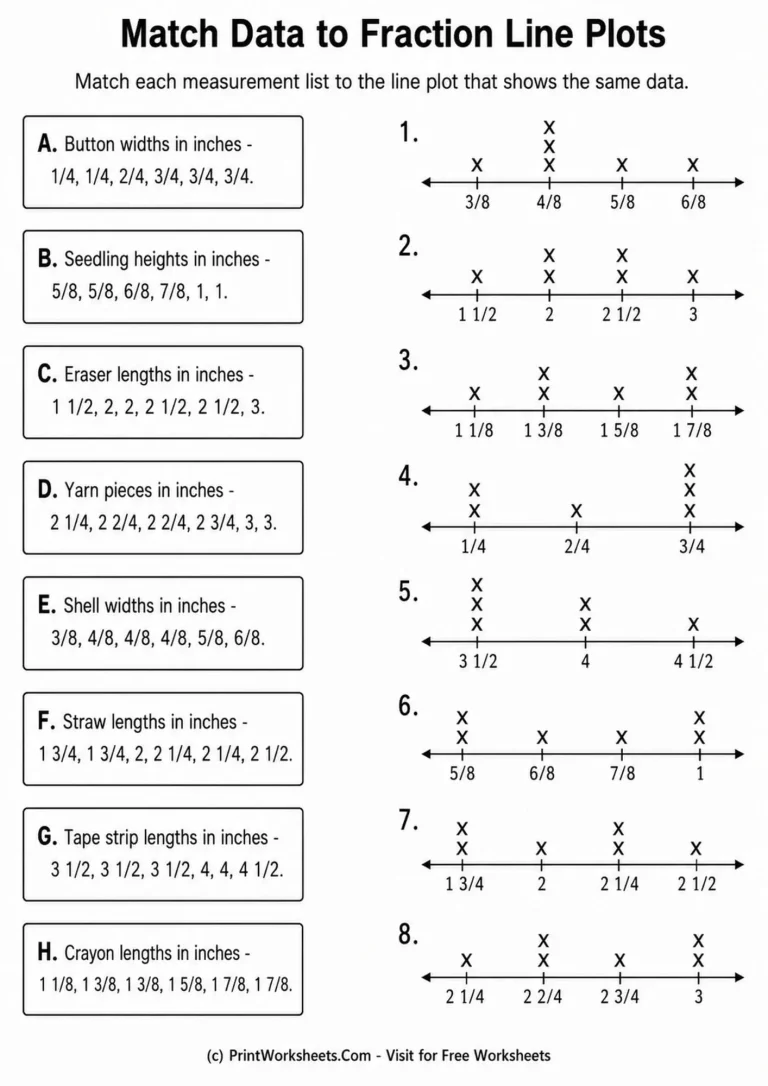
- Match Data to Fraction Line Plots: A fantastic fluency check. Students look at a column of raw data lists and must match them to the correct completed line plot on the other side of the page.
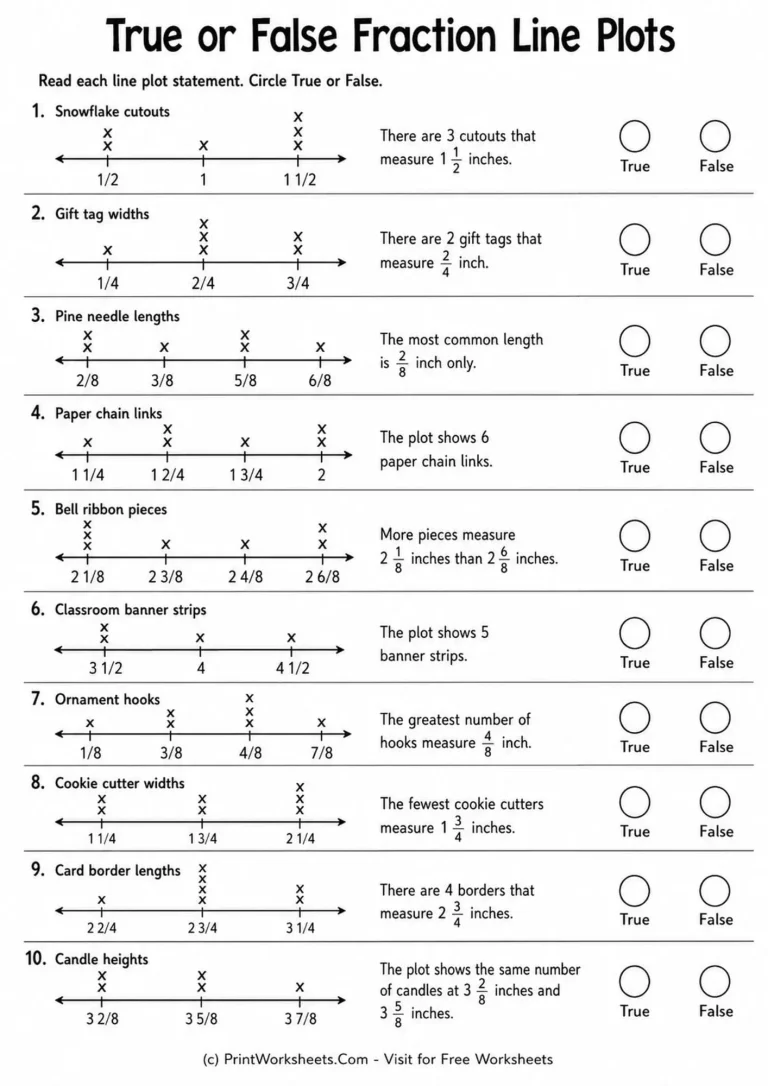
- True or False Fraction Line Plots: An excellent critical thinking exercise. Students look at completed graphs and evaluate statements (e.g., “There are 3 cutouts that measure 1 1/2 inches”). They must circle true or false based strictly on the visual data.
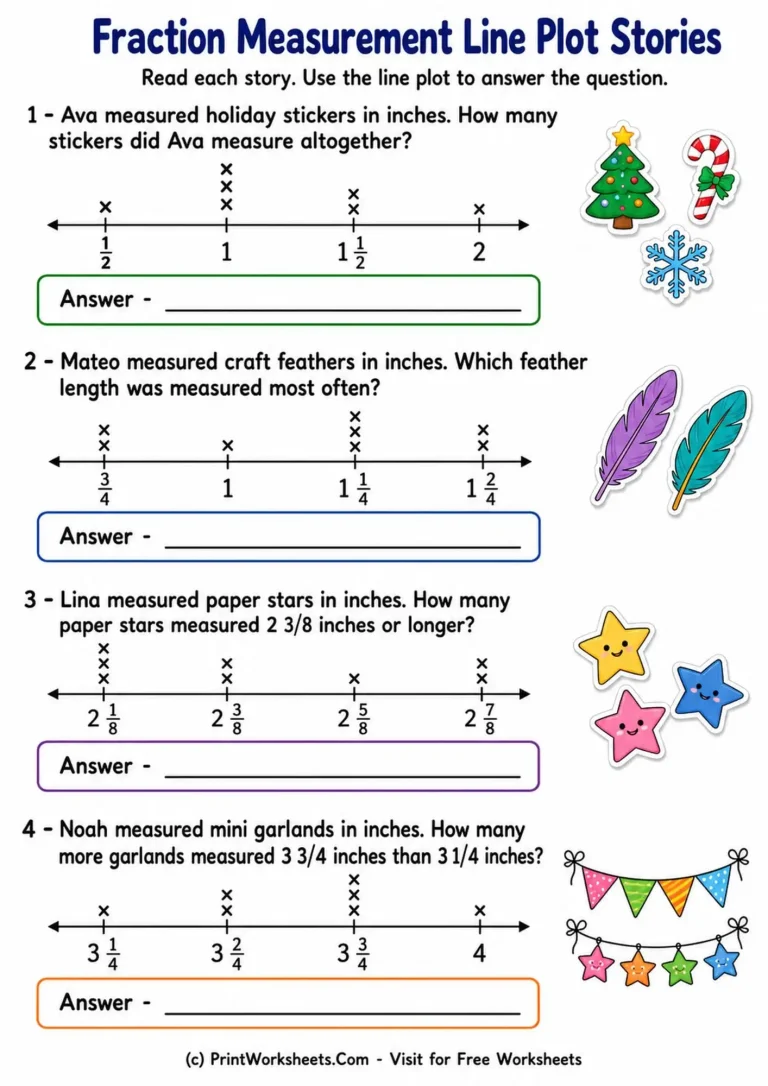
- Fraction Measurement Line Plot Stories: Real-world word problems. Students use provided line plots to answer addition, subtraction, and frequency questions, such as finding how many items were measured altogether or calculating the difference between two data points.
Common Student Mistakes
The most frequent error fourth graders make with these graphs is confusing the ‘X’ (the frequency) with the measurement itself. For example, if a question asks, “What was the most common feather length?”, a student might count three X’s above the 1 1/4 mark and mistakenly write the answer as “3” instead of “1 1/4 inches”. The “True or False” page in this packet is specifically designed to combat this by forcing them to evaluate exactly what the ‘X’s represent versus what the bottom numbers mean.
Classroom Ideas
We highly recommend using the matching worksheet as a morning work activity or a quick warm-up before your main lesson. It gets their eyes trained on reading the data spread without the pressure of math calculations. Later, the word problem stories page is perfect for partner work. Having two students discuss how they got their answers encourages strong math vocabulary and collaborative problem-solving.