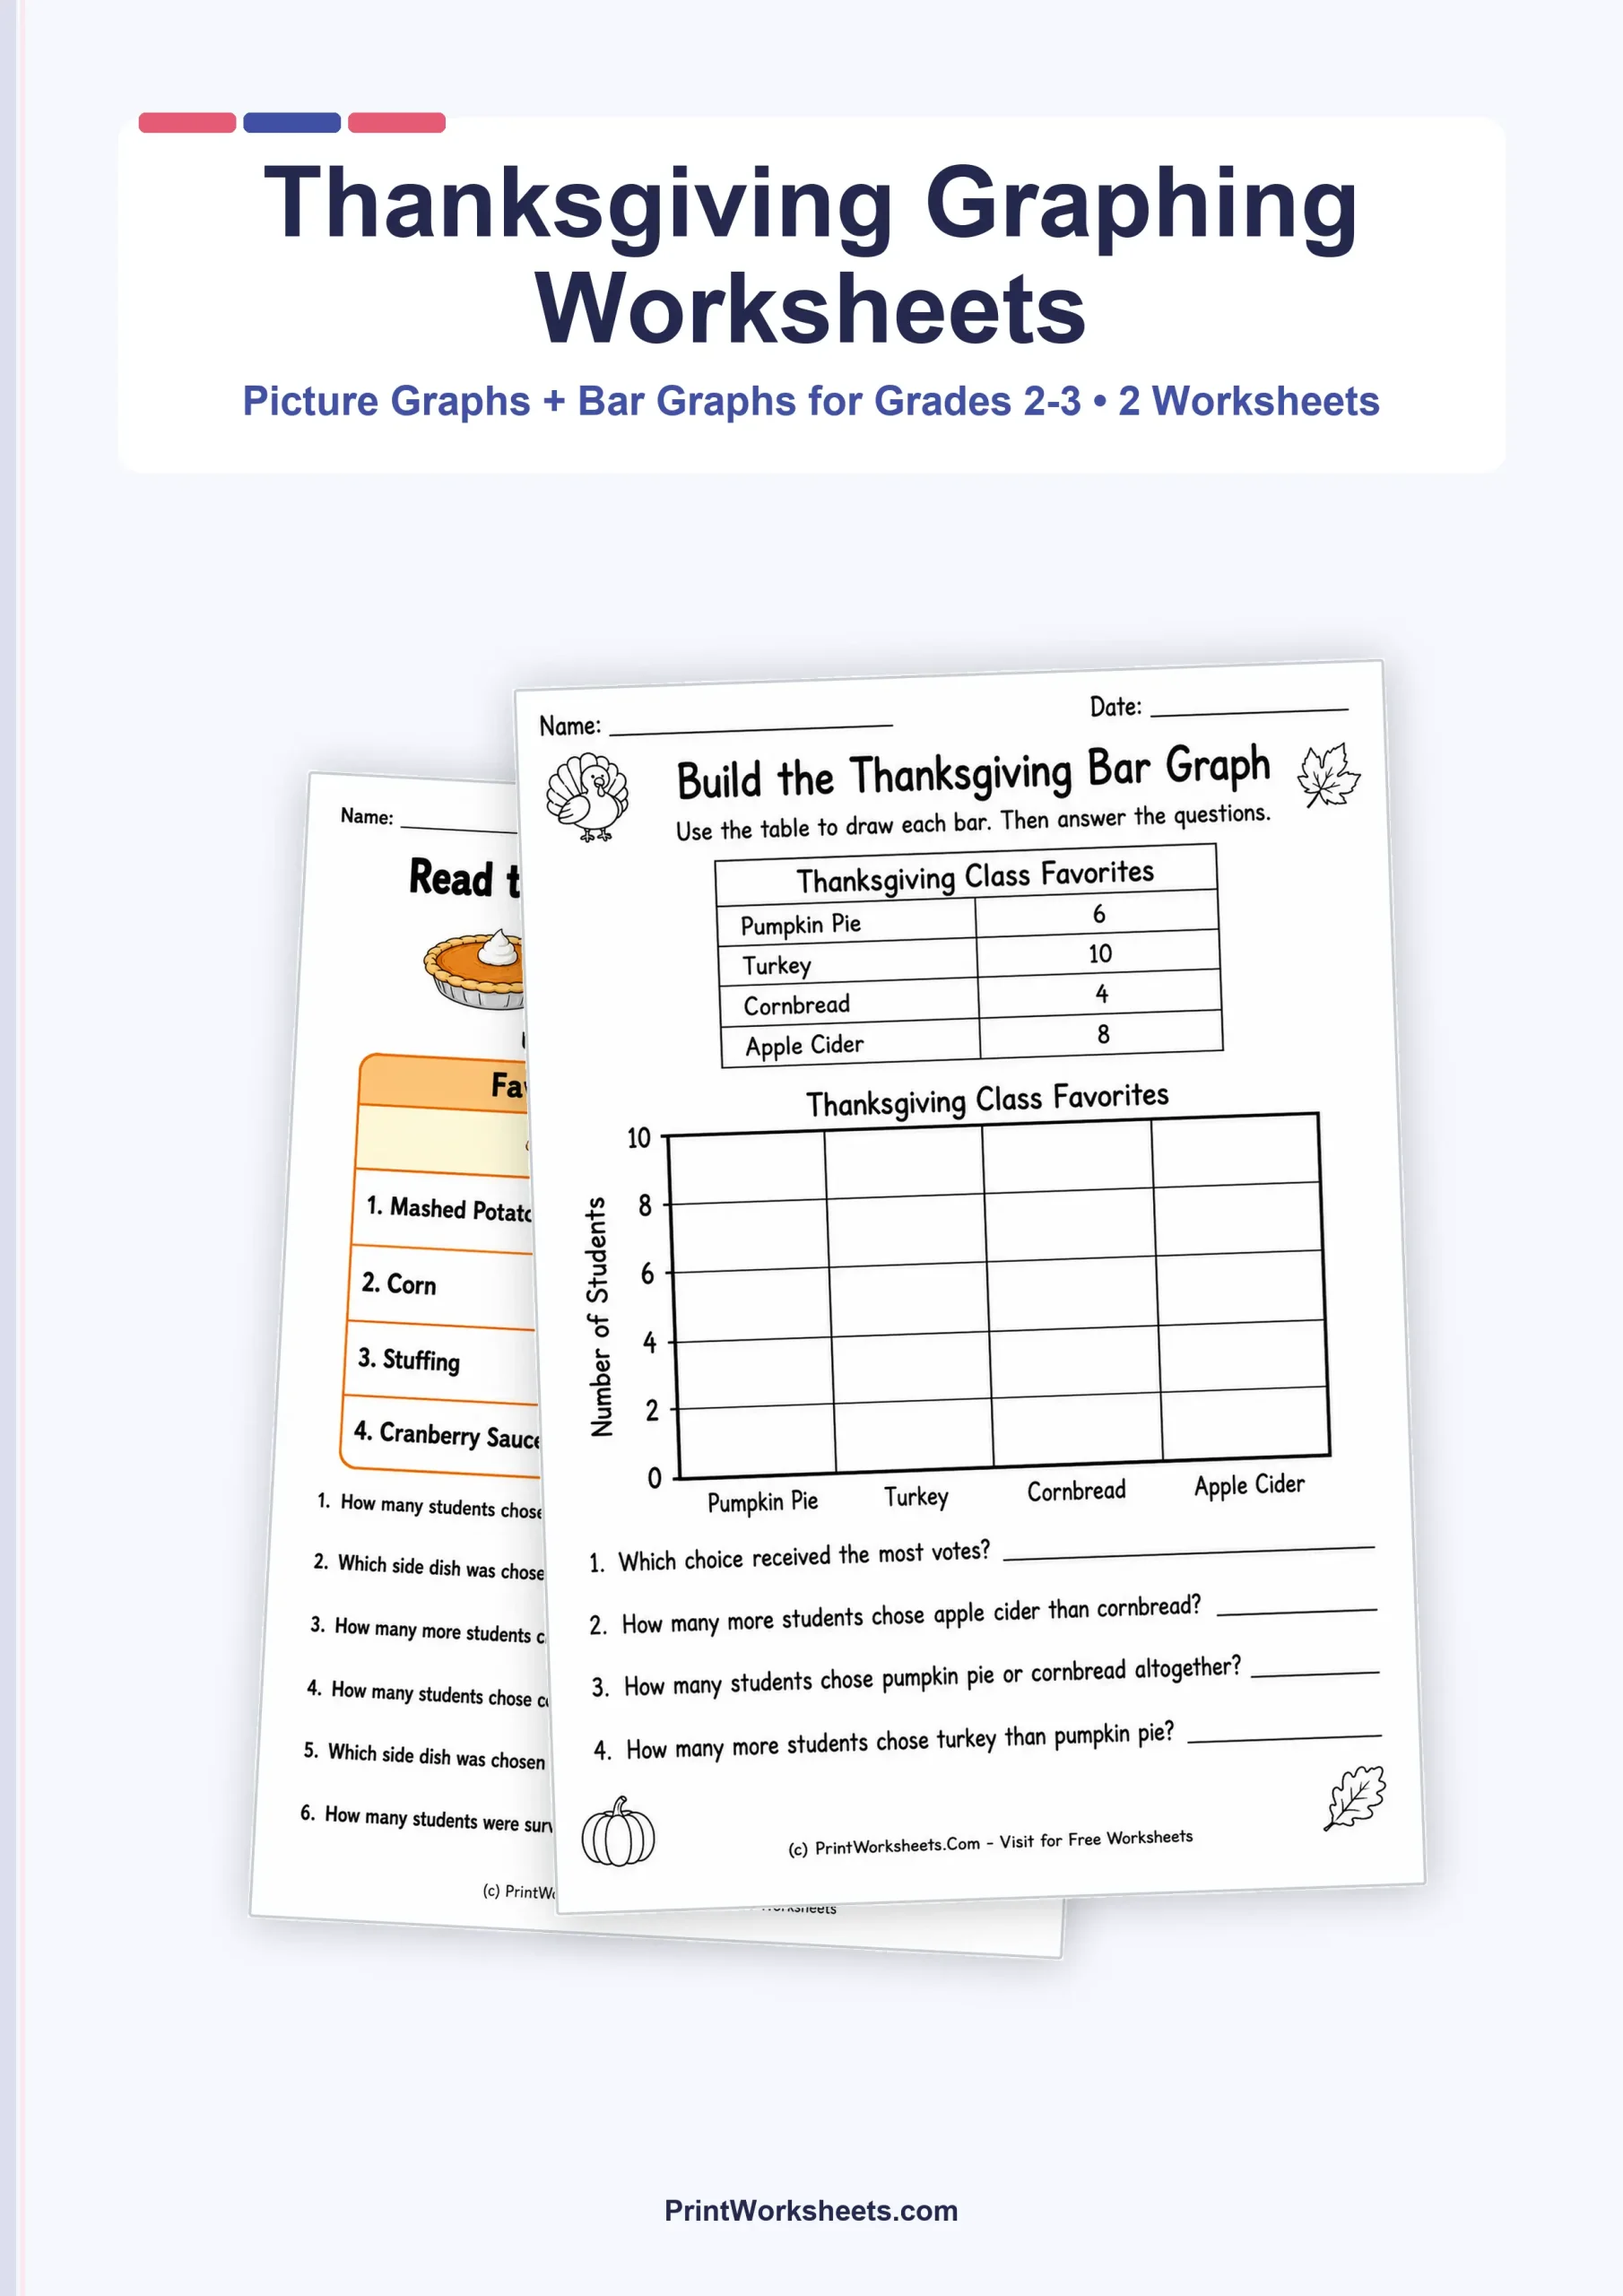
These Thanksgiving graphing worksheets give 2nd and 3rd grade students two different ways to work with holiday-themed data. In the first activity, children read a picture graph in which one pie-slice symbol represents two students. In the second, they move from a numerical data table to a bar graph with a 0-10 scale. Together, the worksheets practice reading graph keys, comparing categories, finding totals and differences, and turning organized data into a visual representation.
Thanksgiving graphing worksheets for reading and building data displays
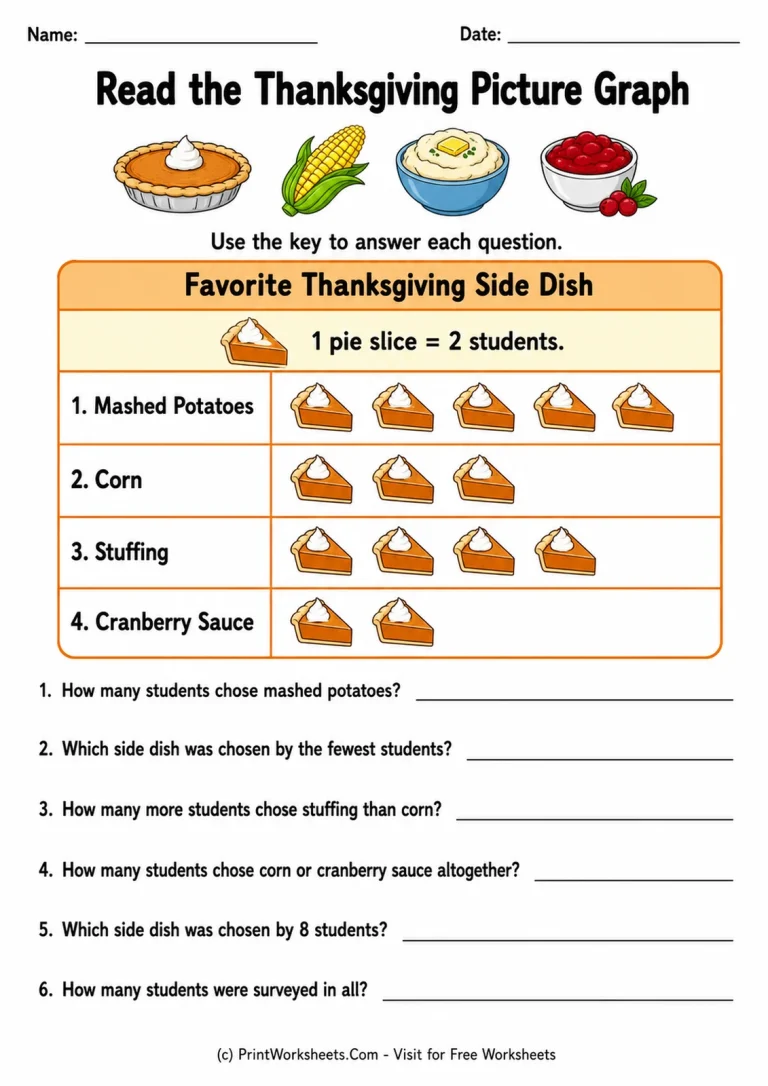
The first worksheet, Read the Thanksgiving Picture Graph, centers on favorite Thanksgiving side dishes. Students compare Mashed Potatoes, Corn, Stuffing, and Cranberry Sauce while using the key correctly: one pie slice equals two students. The completed graph represents 10 students for Mashed Potatoes, 6 for Corn, 8 for Stuffing, and 4 for Cranberry Sauce.
Six follow-up questions ask students to do more than identify the tallest category. They must translate symbols into numerical values, compare quantities, combine categories, and determine totals. Because each symbol stands for two rather than one, the page also reinforces the idea that a graph key controls how the visual data should be interpreted.
From a data table to a Thanksgiving bar graph
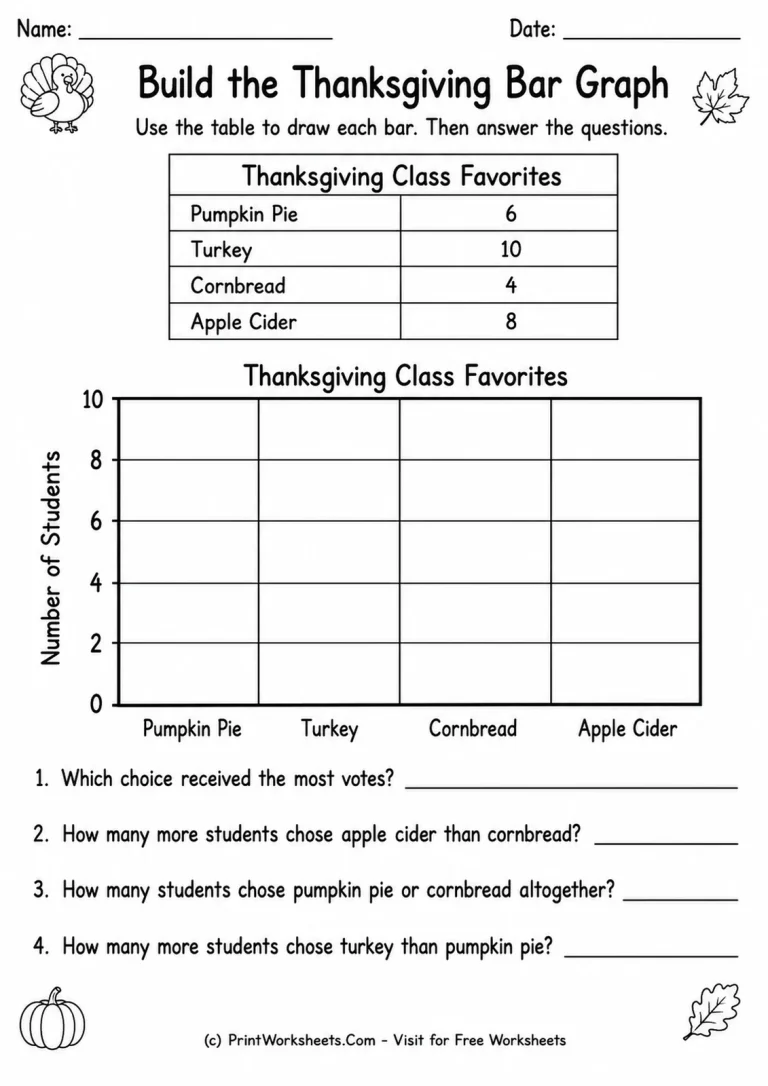
The second worksheet, Build the Thanksgiving Bar Graph, changes the task. Instead of reading a finished display, students receive a Thanksgiving Class Favorites table and create the graph themselves. The table lists Pumpkin Pie as 6, Turkey as 10, Cornbread as 4, and Apple Cider as 8. Students transfer those values to a blank bar graph whose vertical scale runs from 0 to 10 in increments of two.
This construction step is especially useful because students must coordinate the category labels, the numerical values, and the graph scale. A bar representing Turkey must reach 10, while Cornbread must stop at 4. After completing the graph, students answer four questions involving the greatest value, comparisons, differences, and combined amounts. That sequence makes the worksheet suitable for students who are ready to move beyond simply reading an already completed graph.
Skills practiced in this two-page data set
The two activities cover a focused group of elementary data skills without requiring advanced computation. Students practice reading a picture-graph key, identifying category values, comparing data, adding values, subtracting to find differences, reading a scale, and constructing bars from a table. The Thanksgiving context keeps the categories familiar while the mathematics remains the central task.
For 2nd grade, teachers can emphasize accurate counting, repeated addition by twos, and identifying which category has more or fewer responses. For 3rd grade, the same pages can support stronger explanations: students can state how they know one category exceeds another, calculate the exact difference, or describe how the graph would change if a category increased by two students.
Teaching ideas for the picture graph
Before students answer the six questions, point directly to the key and ask what two pie symbols would represent. Once students establish that two symbols mean four students, have them determine each category value before moving to the written questions. This short routine helps prevent the common mistake of counting symbols as if each represented only one person.
Students who need additional support can write the numerical value beside each row of the picture graph first. Students ready for an extension can create one new question using the same four side-dish categories, such as asking how many more students chose Mashed Potatoes than Cranberry Sauce.
Teaching ideas for the bar graph
On the construction page, have students read the scale before drawing any bars. Ask them to locate 4, 6, 8, and 10 on the vertical axis and notice that the labels increase by two. Students can then transfer each value from the Thanksgiving Class Favorites table one category at a time. A quick self-check is to compare every finished bar with its original table value before answering the interpretation questions.
A useful exit ticket is to ask students which worksheet required them to interpret an existing graph and which required them to create a graph from data. They can then name one similarity between the two representations. This reinforces that both displays organize information even though they present it differently.
Ways to use the worksheets during Thanksgiving math
The pages work well as a short holiday data lesson, independent practice after graphing instruction, a math-center activity, or a review before a data assessment. They can also be split across two days: use the picture graph first to review keys and comparison questions, then use the bar graph on the following day to shift students from interpretation to construction.
If younger students need an easier holiday-themed starting point before working with these graphing tasks, the Canadian Thanksgiving worksheets for 1st grade provide another seasonal option. For the current set, a simple final challenge is to ask students to invent a fifth Thanksgiving category, choose an even value from 0 to 10, and explain where its bar would appear on the graph.