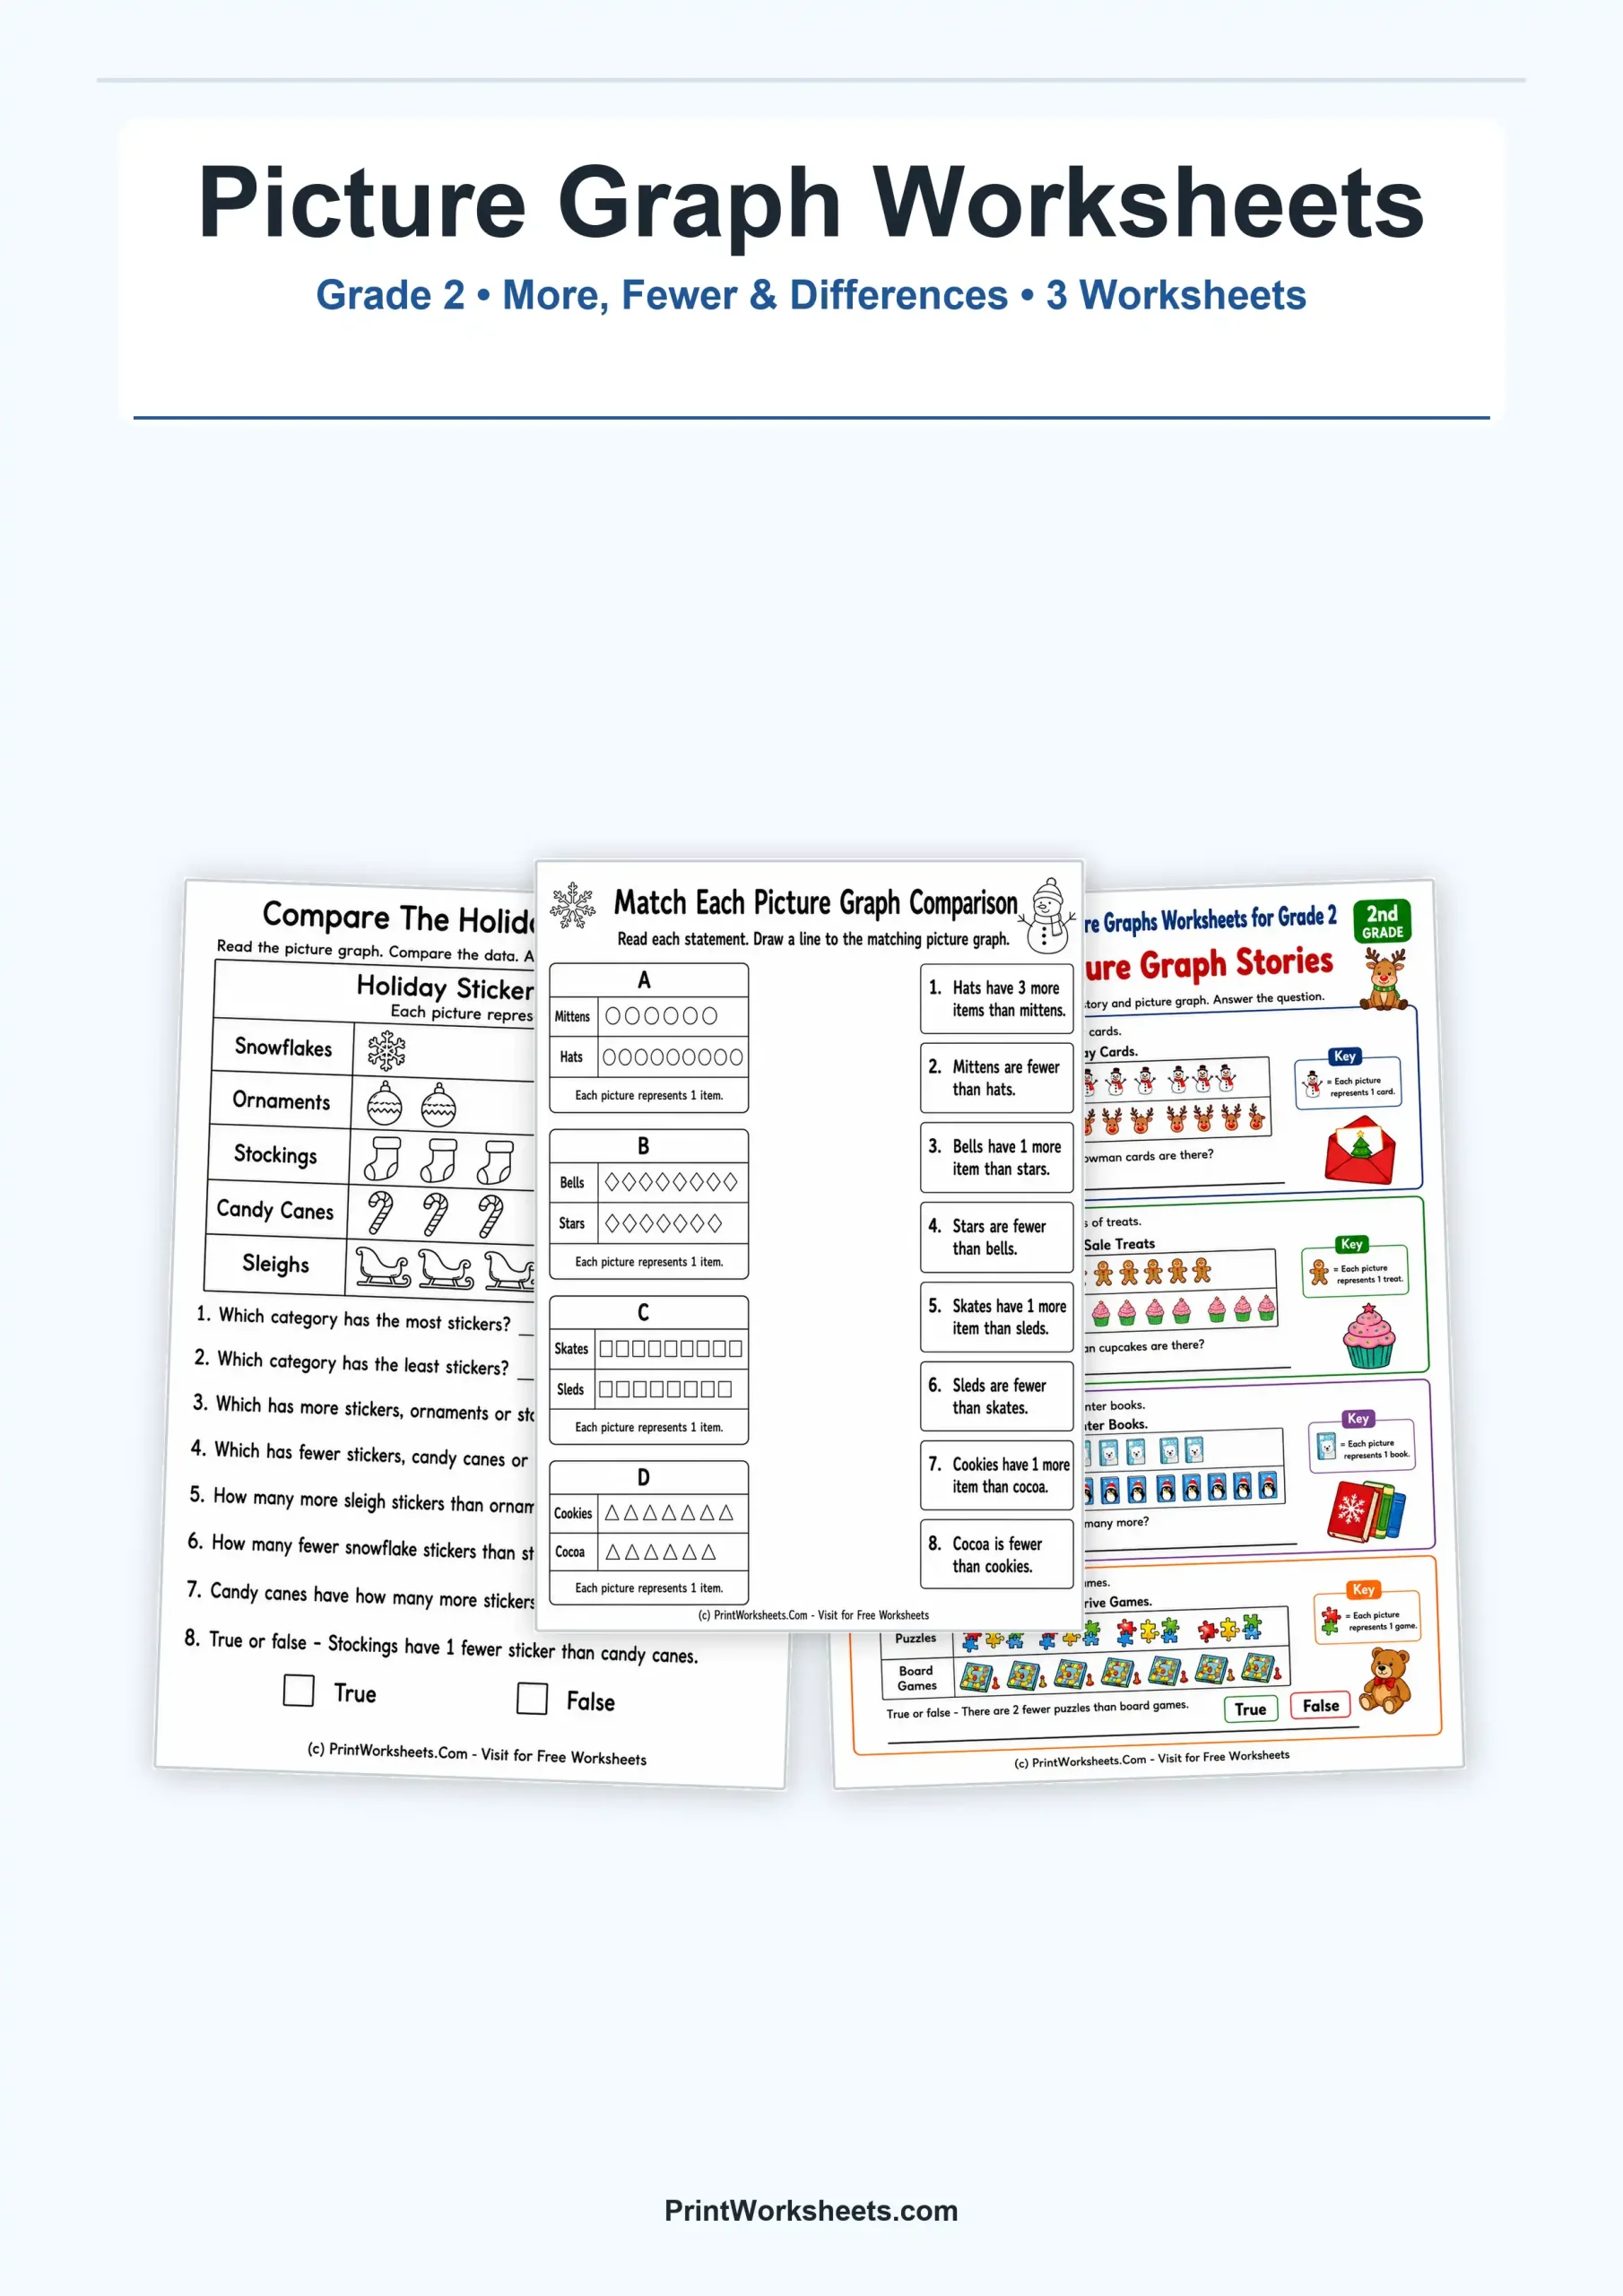
These picture graph worksheets give Grade 2 students a concrete way to compare data by counting symbols, deciding which category has more or fewer items, and finding small differences between totals. The set uses familiar holiday and winter themes, but the mathematics stays focused on reading one-picture-equals-one-item graphs. Students move from direct questions about a single graph to matching comparison statements with several graphs and then to short story-based data problems.
What Students Practice with Picture Graph Worksheets
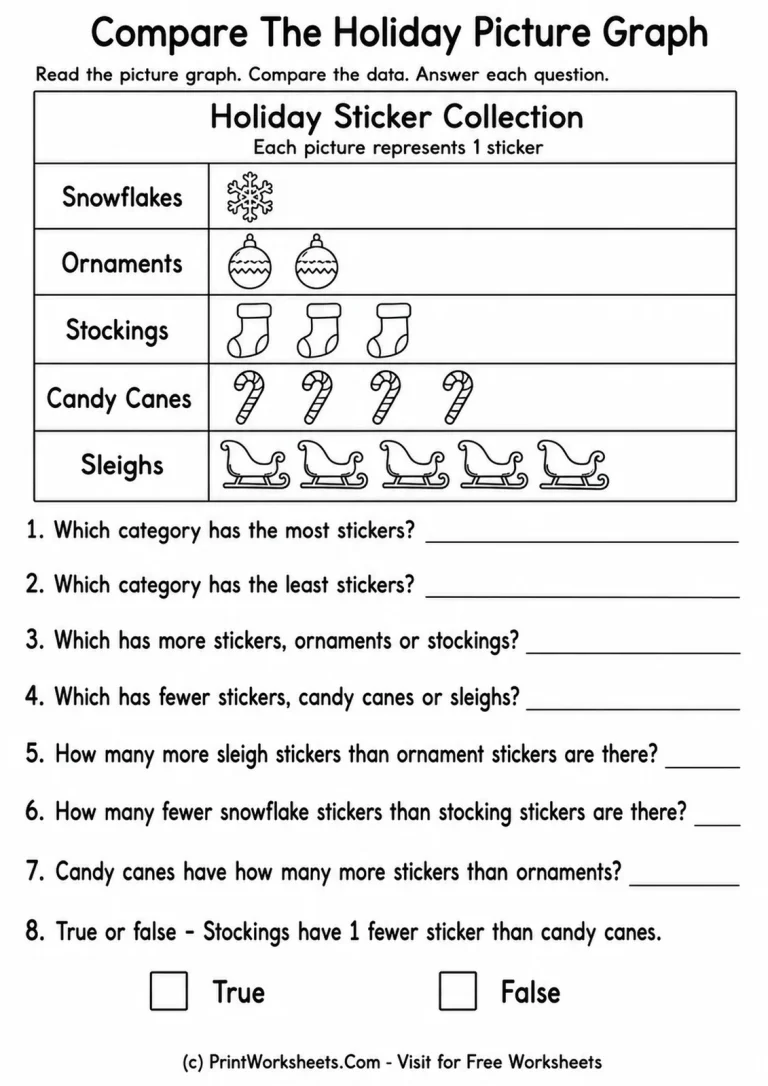
The first worksheet centers on a Holiday Sticker Collection. Five categories—snowflakes, ornaments, stockings, candy canes, and sleighs—contain one through five pictures. Because each picture represents one sticker, students can see the quantities immediately and compare them without needing a complicated key. Questions ask which category has the most or least stickers, which of two categories has more or fewer, and how many more or fewer one category has than another. A final true-or-false statement checks whether students can turn a visual comparison into a numerical relationship.
Matching Comparison Statements to Graphs
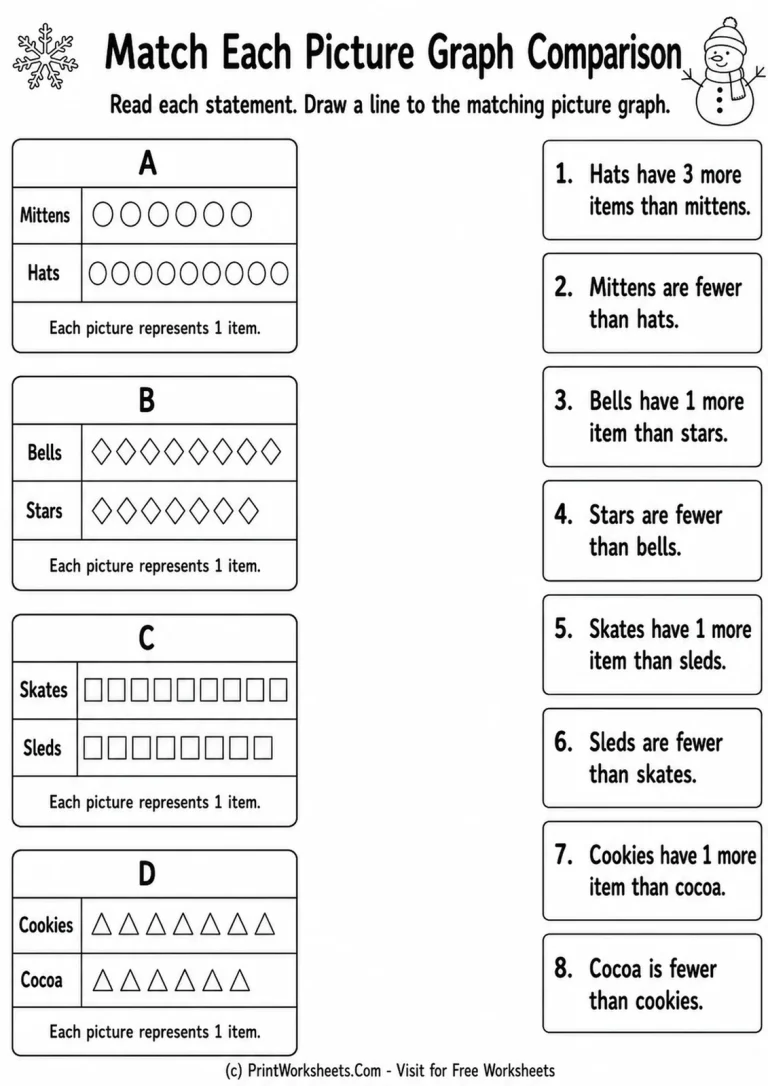
Another worksheet changes the task from answering isolated questions to matching statements with the correct graph. Four labeled graphs compare mittens and hats, bells and stars, skates and sleds, and cookies and cocoa. Students read statements about one category having more items or another having fewer and connect each statement to the graph that proves it. This format is useful because students must do more than count. They also need to interpret comparison language and decide which visual data set supports the sentence.
This activity can reinforce vocabulary such as more, fewer, and how many more. It also encourages students to check both rows of a graph before deciding rather than simply choosing the category with the larger-looking symbols.
Holiday Picture Graph Story Problems
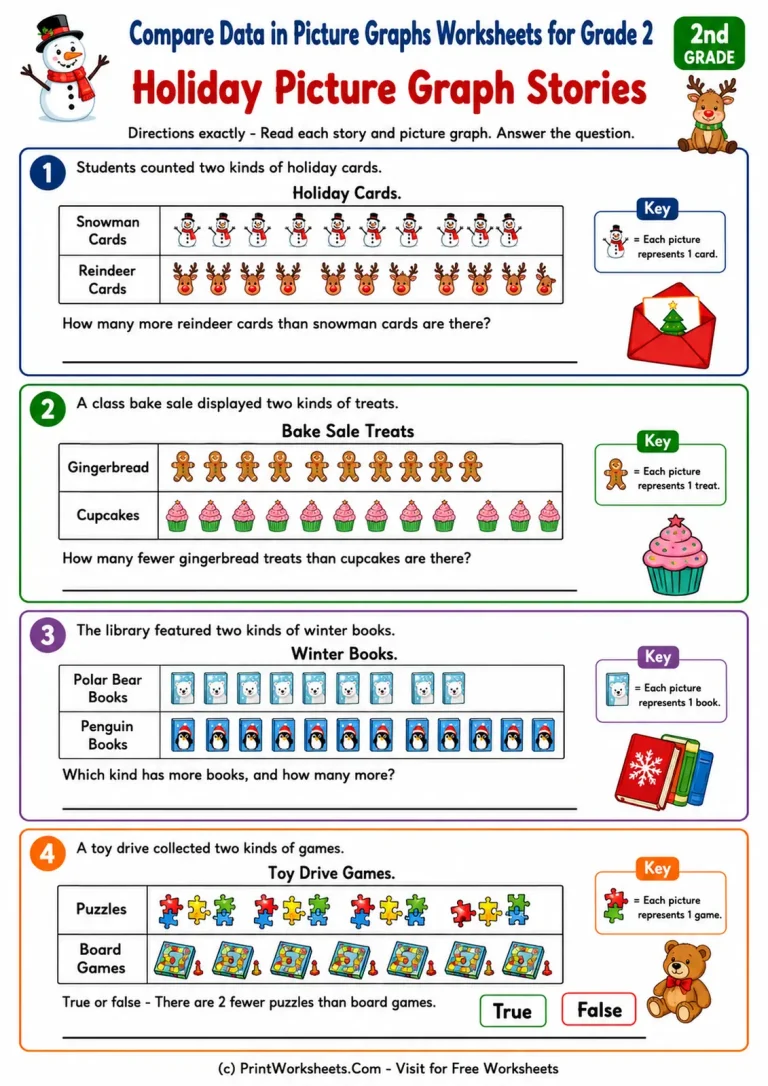
The story-based worksheet adds short contexts around each graph. Students compare snowman and reindeer cards, gingerbread treats and cupcakes, polar bear and penguin books, and puzzles and board games. Each picture still represents one item, so the challenge comes from understanding the question and comparing the two totals correctly.
The questions include finding the difference between two categories, identifying which group has more, and evaluating a true-or-false statement. These are useful Grade 2 data skills because students connect a visual display to addition and subtraction thinking. Instead of treating a graph as decoration, they use it as evidence for an answer.
A Useful Progression for Grade 2 Data Practice
The three worksheets work well as a short progression. Start with the Holiday Sticker Collection page when students are learning to count symbols and compare totals. Move to the matching page when they are ready to connect words such as more and fewer to multiple graphs. Finish with the holiday story page when students can read a short context, identify the two relevant data groups, and calculate a difference.
For independent work, ask students to lightly mark or count each symbol before answering. During small-group instruction, have students explain answers in complete comparison sentences such as “Sleighs have three more stickers than ornaments.” This makes the math language visible and helps teachers hear whether a student understands the relationship or has only guessed from the picture.
Connect Picture Graphs to Other Grade 2 Graphing Skills
Picture graphs are a strong bridge to other ways of representing data. After students are comfortable comparing icons, they can practice reading bar graph worksheets with picture data. That next step keeps the data familiar while changing the representation.
Students can also compare these activities with tally chart data questions, where quantities are recorded with tally marks instead of pictures. For a more productive graphing task, use bar graphs from tables worksheets so students move from interpreting data to constructing a graph from given values.
Use the set for classwork, math centers, review, or a quick check of whether students can compare categories accurately. The changing formats keep the skill consistent while requiring students to read, count, compare, and explain data in slightly different ways.