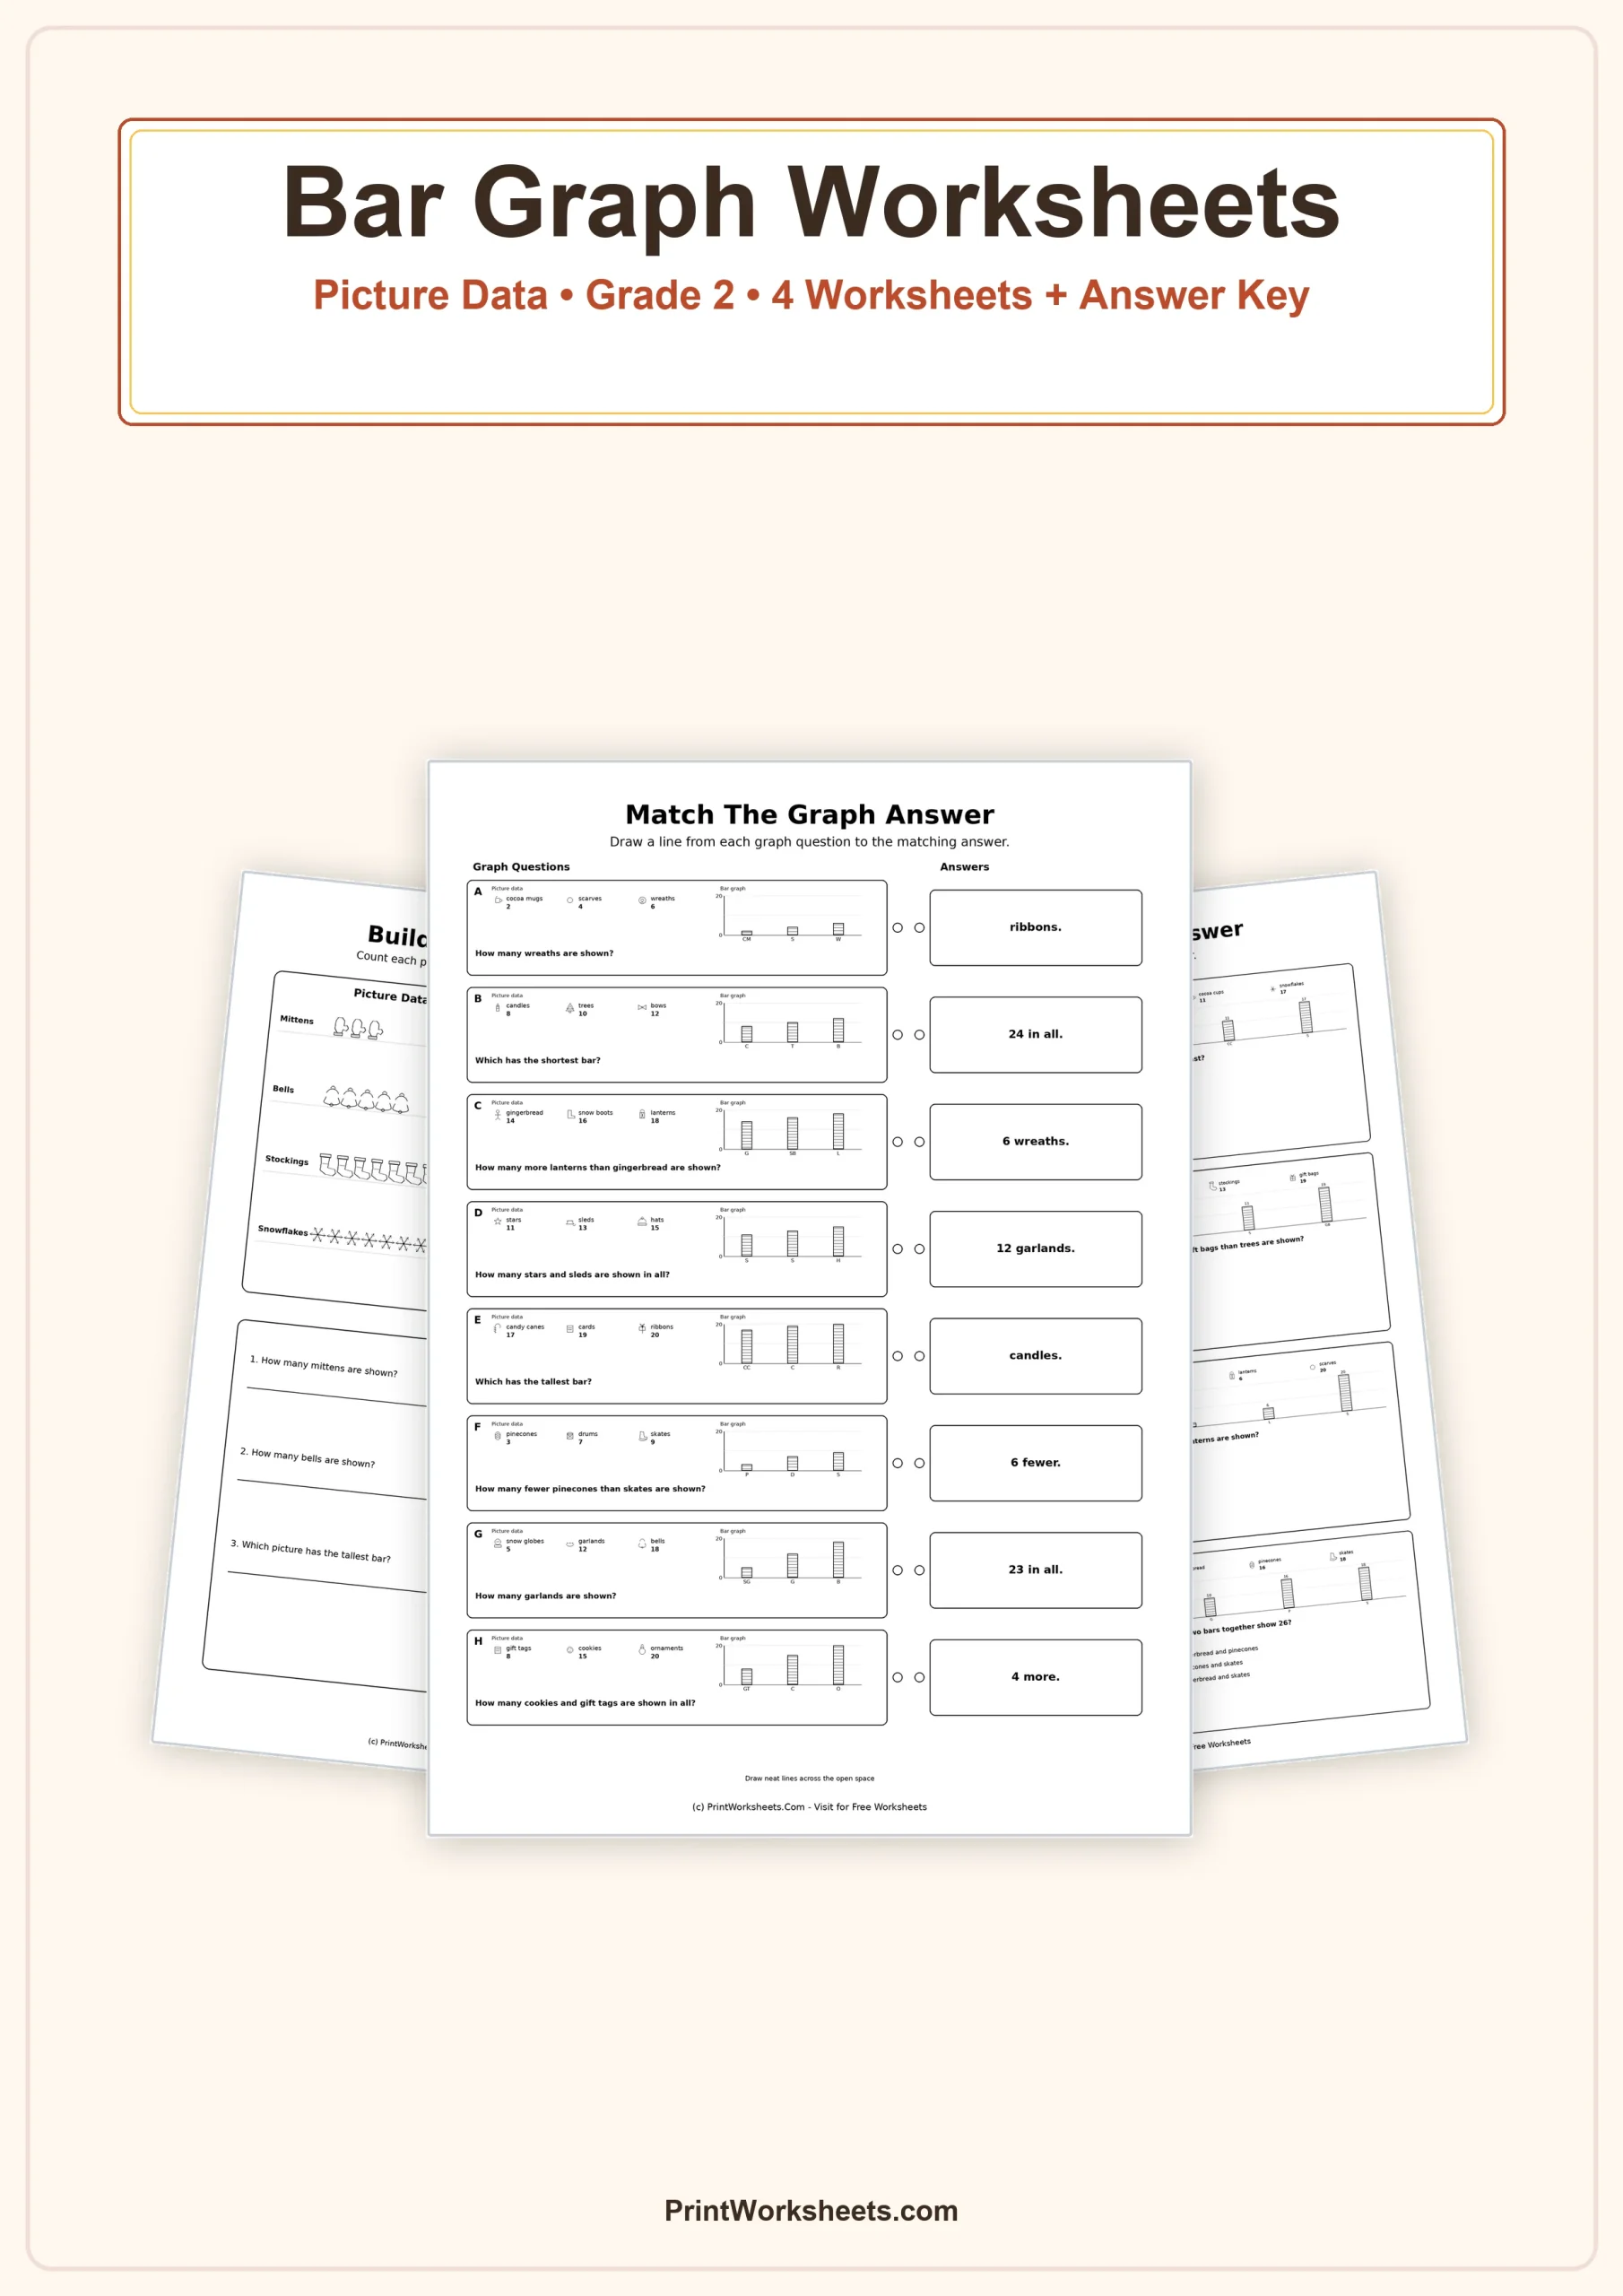
When second graders can see the data before they graph it, the connection between counting and bar height becomes much easier to understand. These bar graph worksheets use simple picture data to help students move from counting objects to reading, building, and comparing bars. Across four student pages, children work with winter and holiday-themed items such as mittens, bells, stockings, snowflakes, wreaths, candles, trees, cookies, scarves, and boots. The activities mix direct counting with graph interpretation, addition, subtraction, and comparison so students practice more than just locating a number on a chart.
Bar Graph Worksheets That Start with Picture Data
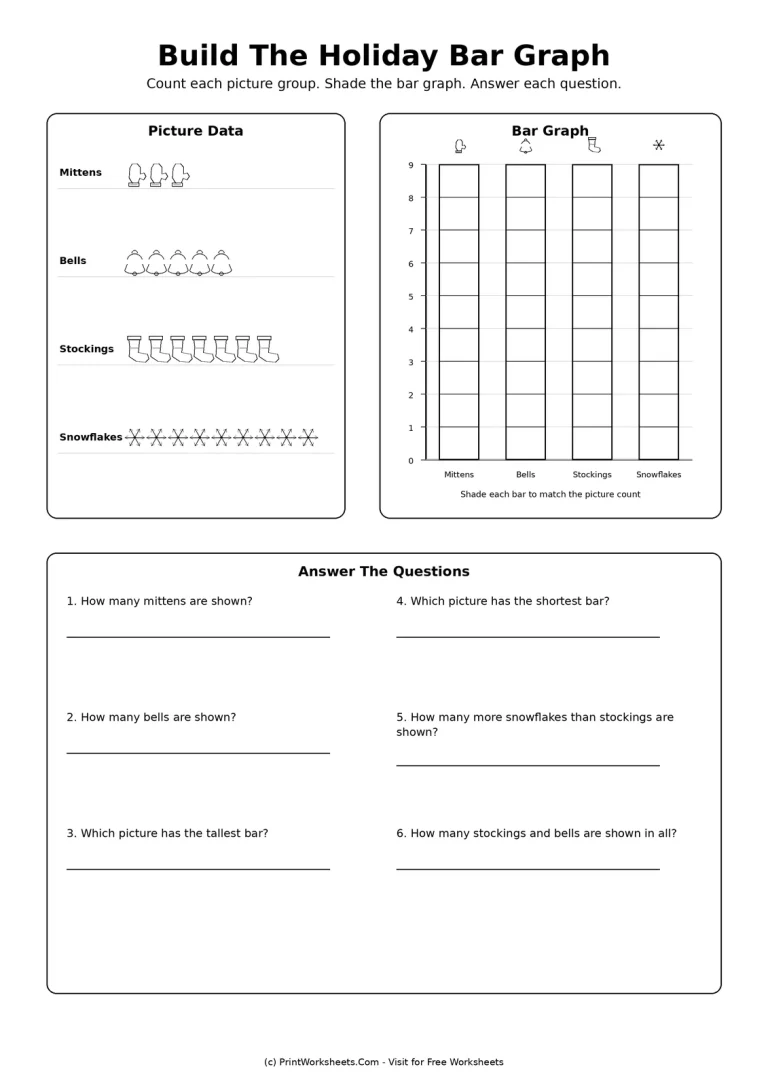
The first worksheet gives students a clear bridge from pictures to a graph. They count four picture groups: 3 mittens, 5 bells, 7 stockings, and 9 snowflakes. A blank bar graph with a 0-9 scale is provided beside the picture data, and students shade each bar to match the count. After building the graph, they answer six questions about exact quantities, the tallest and shortest bars, a difference, and a combined total. This page is especially useful when introducing the idea that every bar represents a counted amount.
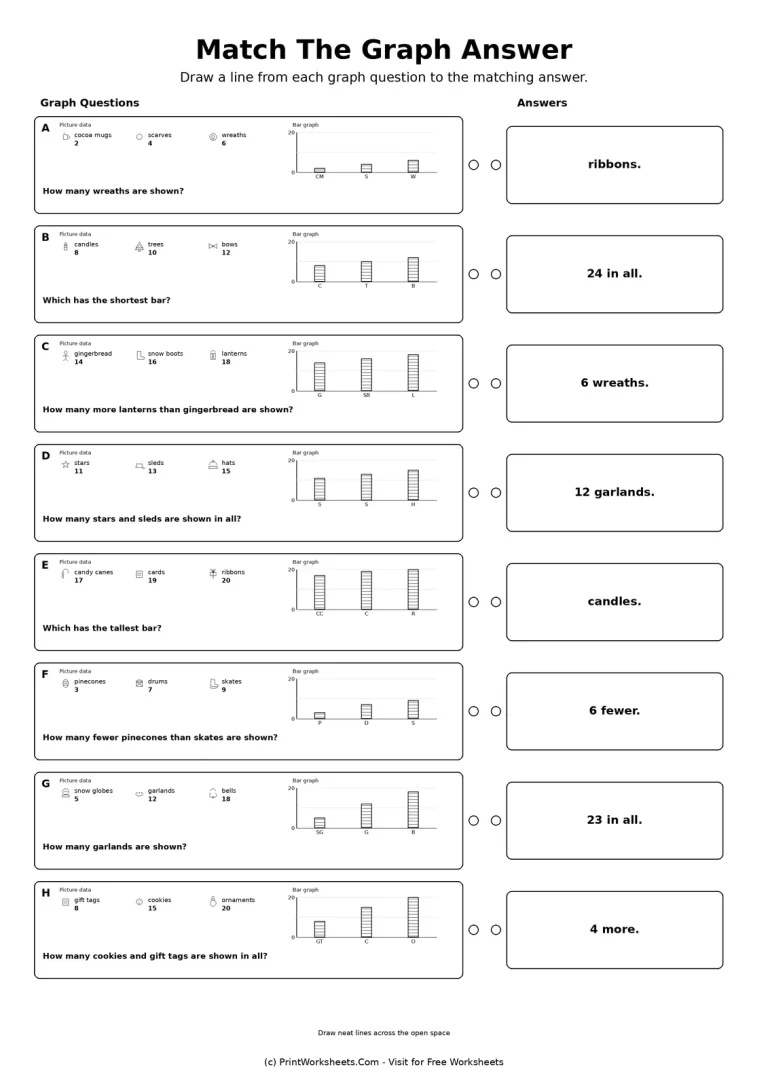
The second page changes the response format. Eight small picture-data and bar-graph examples are labeled A through H, and students draw lines to match each graph question with its correct answer. The questions include reading an exact value, identifying the shortest or tallest bar, finding how many more or fewer, and combining two amounts. Because the answer choices are separated from the graph cards, students have to interpret each mini graph before making a match rather than relying on a repeated multiple-choice pattern.
Reading and Comparing Bar Graphs in Grade 2
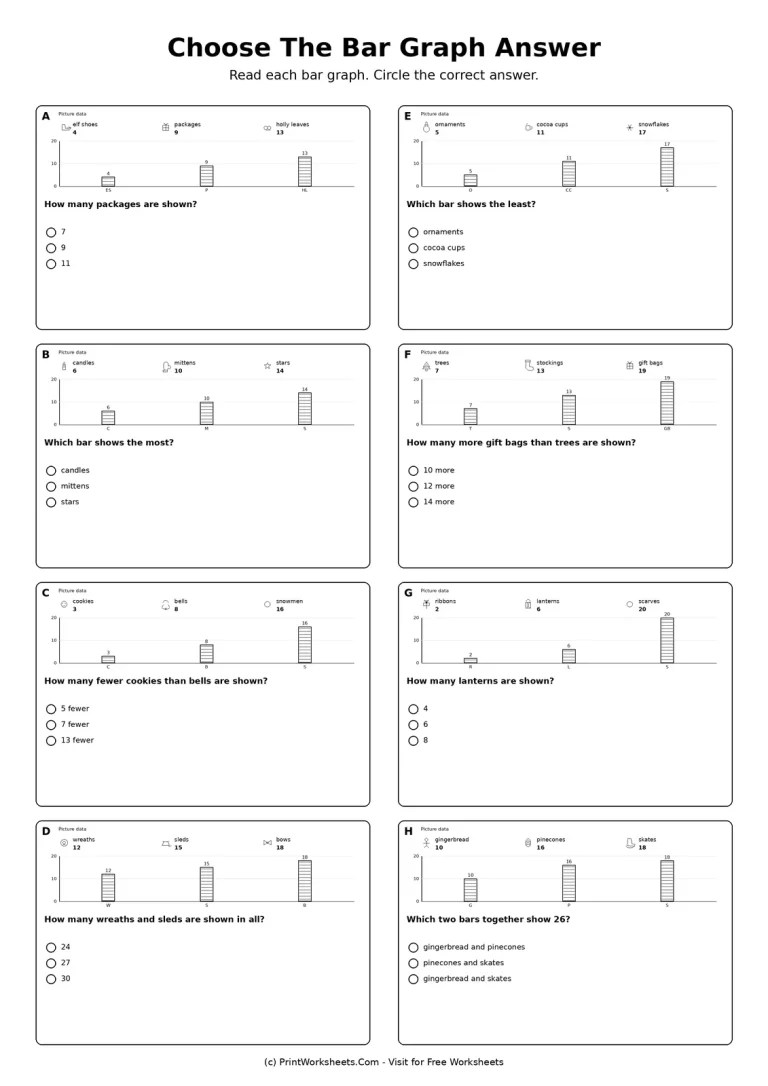
The third worksheet provides eight multiple-choice graph questions. Each problem shows three categories with picture-data labels and corresponding bars. Students answer questions such as how many packages are shown, which bar represents the most or least, how many fewer one category has than another, and which two bars make a stated total. Values stay within a manageable Grade 2 range while still requiring students to compare quantities carefully. For example, one problem asks students to combine wreaths and sleds, while another asks which pair of categories totals 26.
Story Problems Add a Second Step
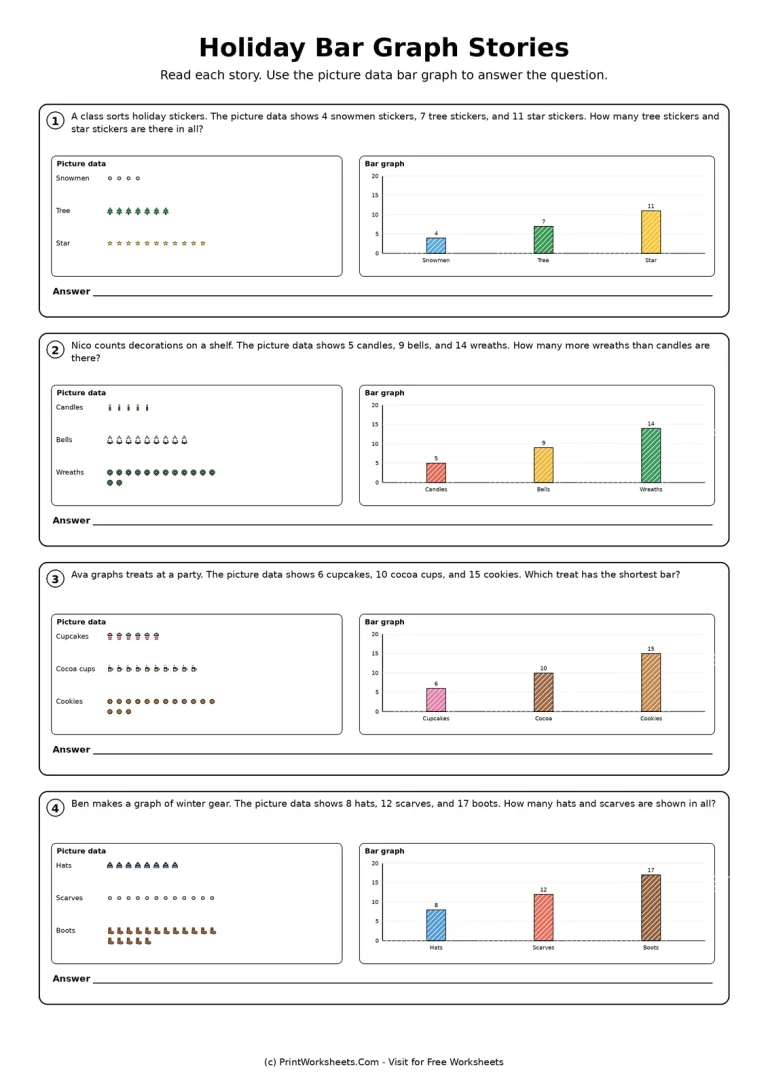
The fourth worksheet places the graph skills inside short word problems. Each story includes picture data and a matching bar graph, so students can check the same information in two visual forms before answering. One story asks for the total number of tree and star stickers, another asks how many more wreaths than candles are shown, another asks which treat has the shortest bar, and the final problem combines hats and scarves. These questions help students connect graph reading to the addition and subtraction language they see in everyday math problems.
What Students Practice Across the Set
This set gives repeated practice with several connected Grade 2 data skills. Students count picture symbols, transfer quantities to bar heights, read labeled categories, compare bar lengths, identify greatest and least values, find differences, and add two categories together. The numbers range from very small counts to values around 20, allowing children to focus on the graph rather than on difficult computation. Because the pages use different activity structures, teachers can also see whether a student understands the data independently of a particular worksheet format.
Ways to Use These Printable Graphing Pages
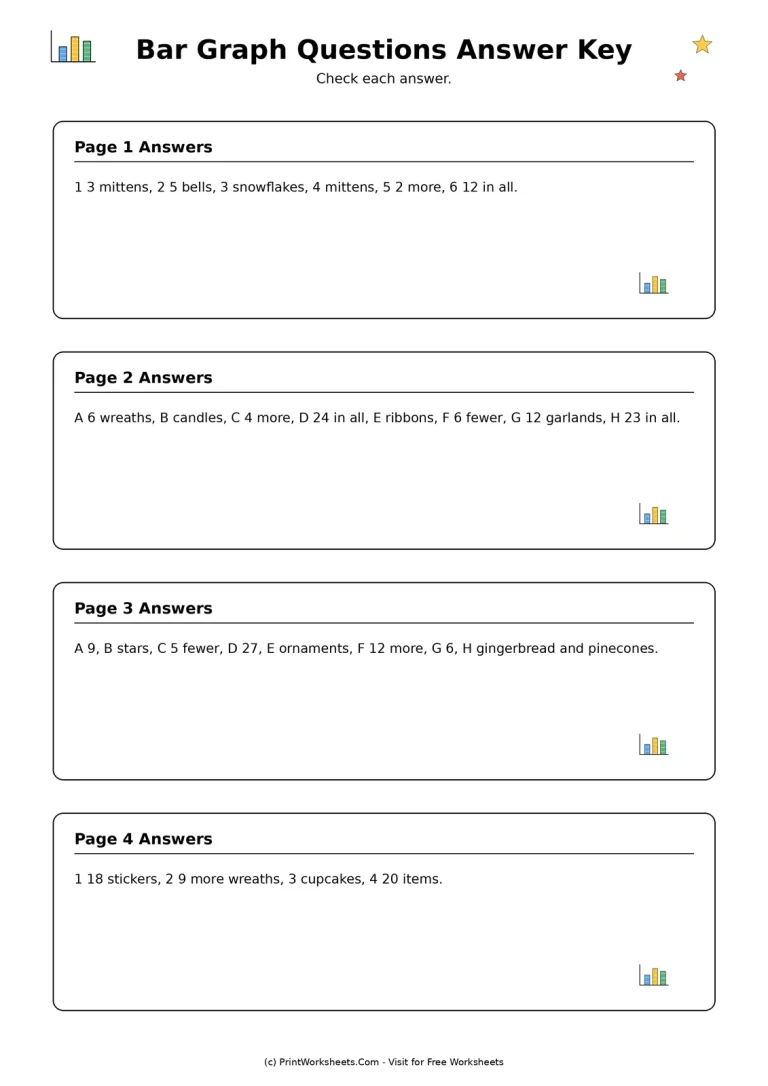
Use the first page for direct instruction or a guided math group because students physically build the graph from the picture counts. The matching page works well for centers or partner practice. The multiple-choice page can be used for independent work, a quick assessment, or homework. The story-problem page is a useful follow-up once students are comfortable reading bars because it asks them to decide which operation or comparison the question requires. The included answer key covers all four student pages, making the set practical for classroom checking, tutoring, or home practice.
Extend Picture-Based Math Practice
Students who benefit from visual counting can continue with picture addition worksheets for extra work connecting objects to number totals. For younger learners who still need very direct visual support, the kindergarten picture addition worksheets provide a simpler circle-the-sum format. Together, these resources can help students move from counting pictures, to combining quantities, to representing and interpreting those quantities in a bar graph.
These Grade 2 bar graph pages work particularly well as a short data-and-graphing sequence: begin by building a graph, continue with matching and multiple-choice interpretation, and finish with story-based questions. That progression keeps the visual support students need while gradually asking them to make more decisions on their own.