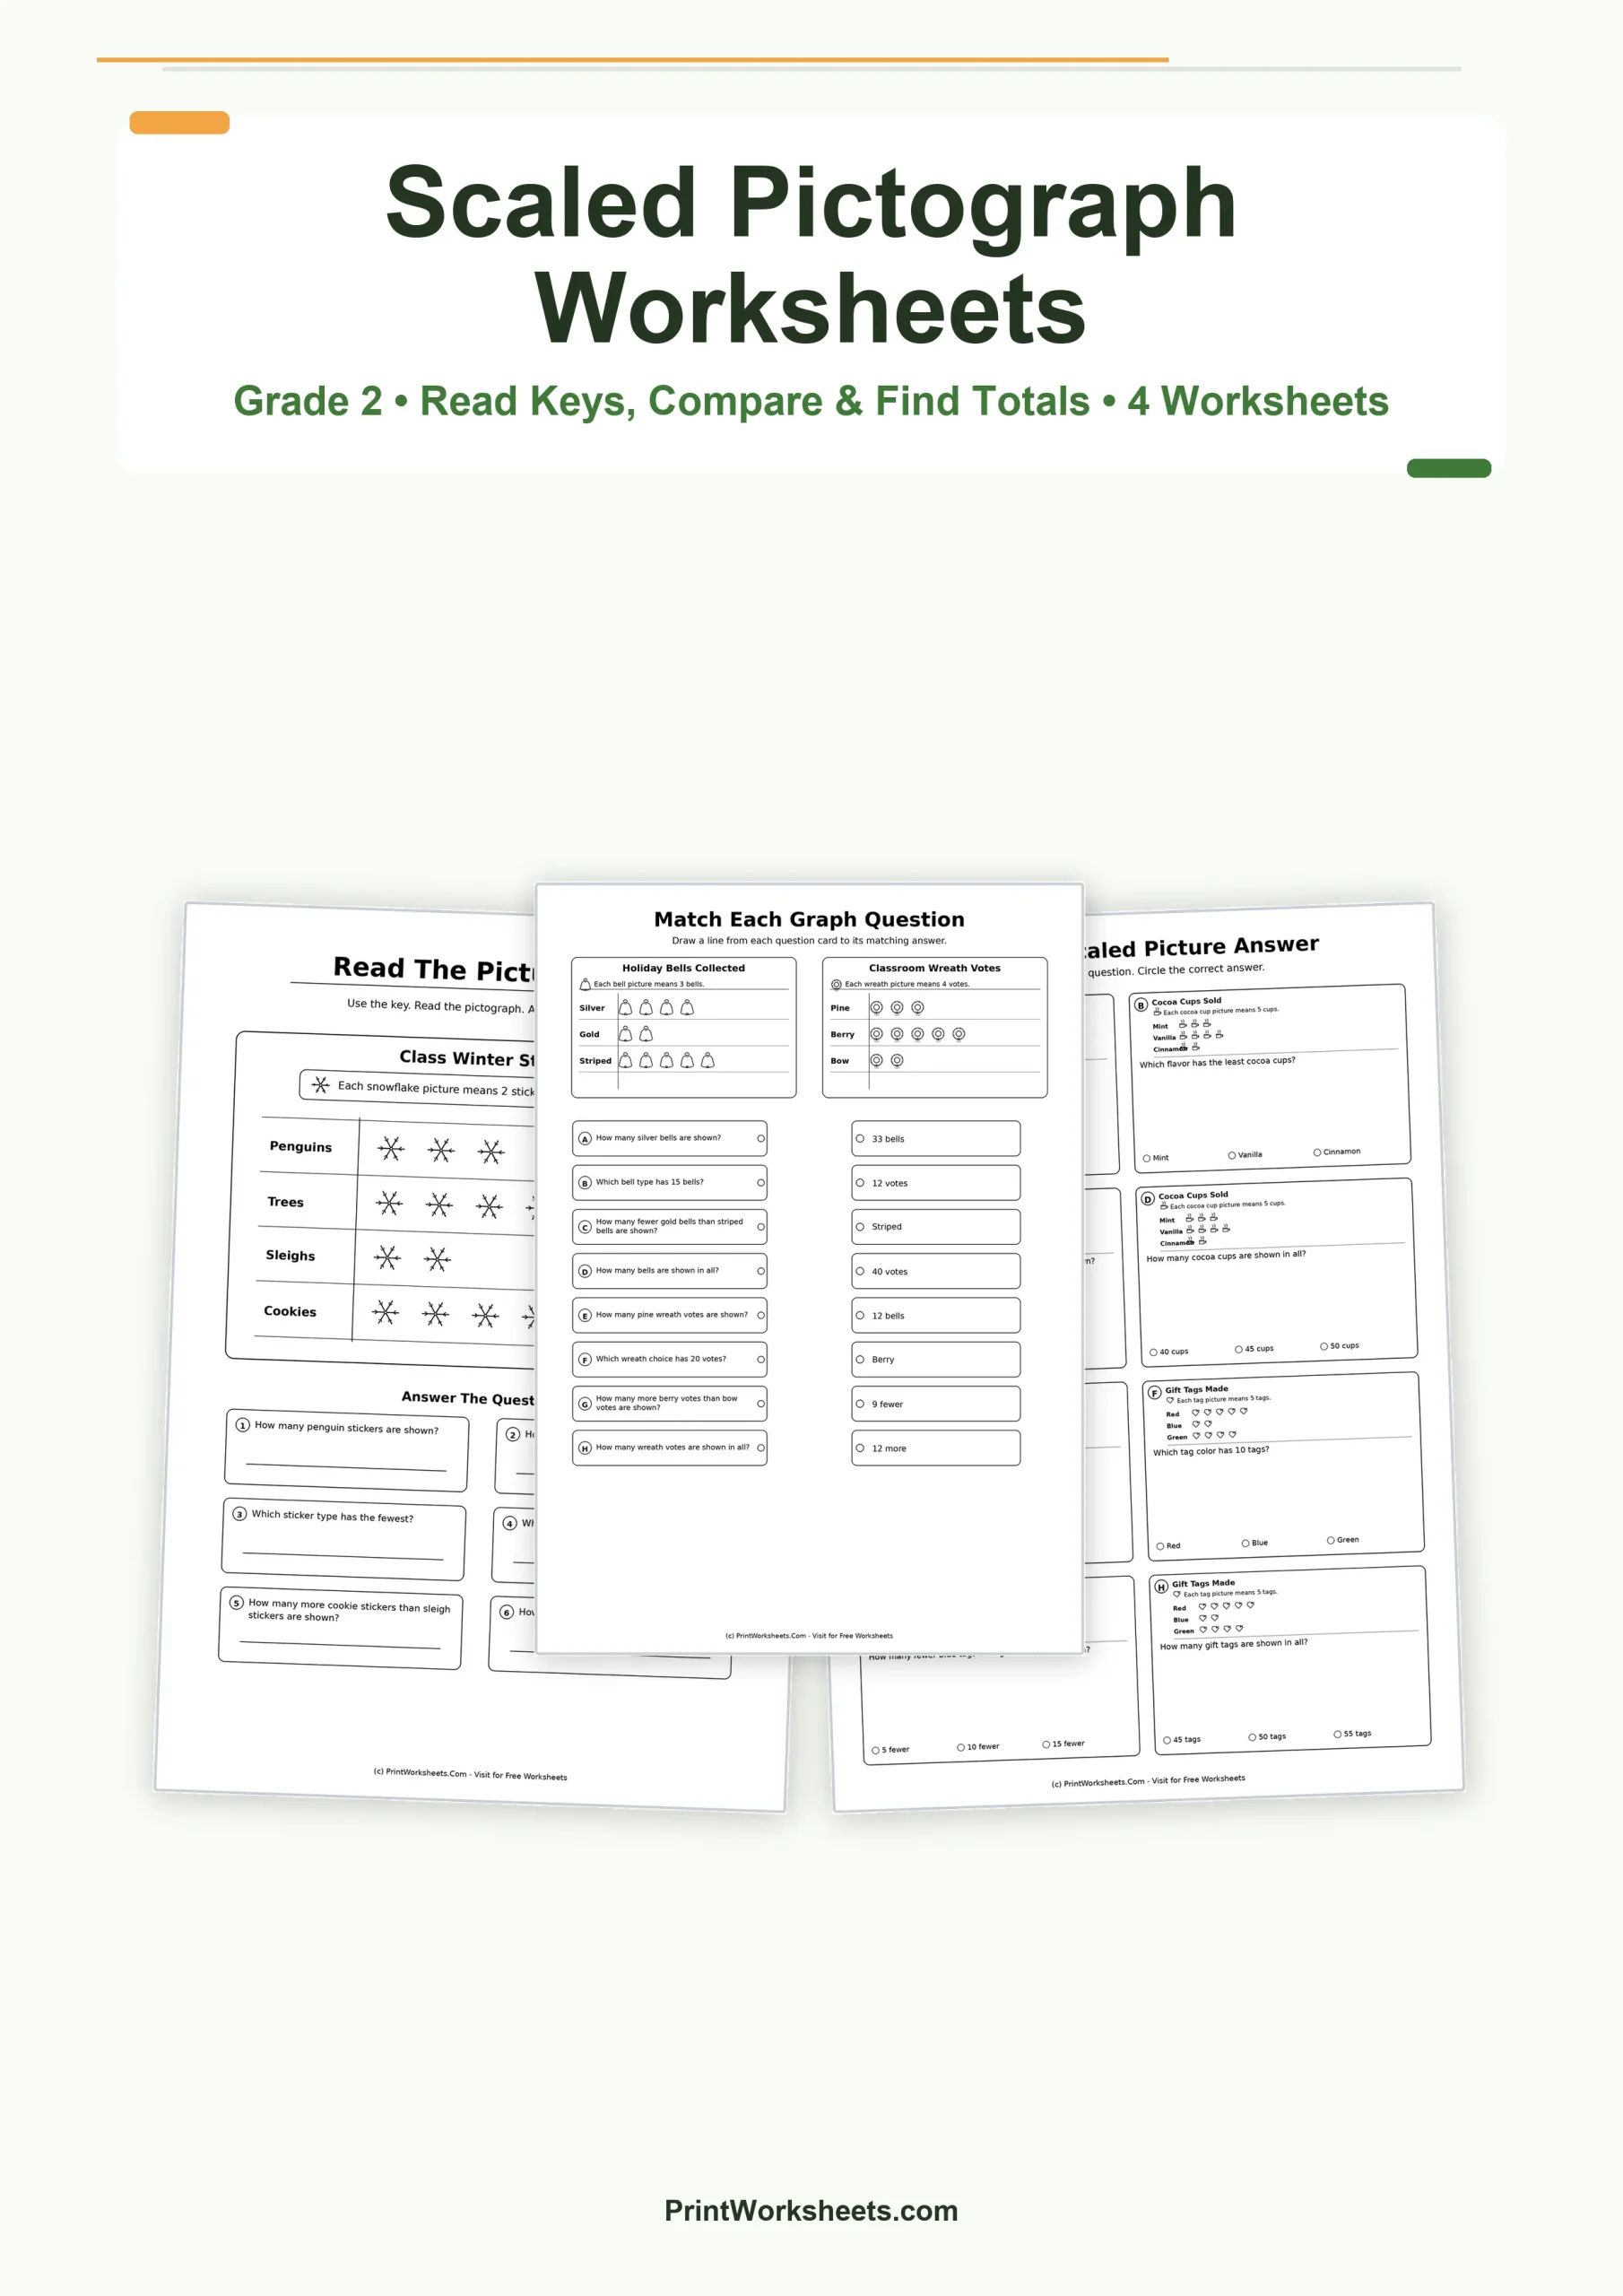


These scaled pictograph worksheets give second grade students repeated practice using a picture key before answering questions about data. Across four different worksheet formats, children work with symbols that represent 2, 3, 4, or 5 items at a time. The questions move beyond simply counting pictures: students calculate totals, compare categories, identify the most or least, determine how many more or fewer, and apply the same thinking to short story situations.
Practice Reading Scaled Pictographs in Grade 2
A scaled pictograph requires students to pay attention to two pieces of information at once: the number of pictures shown and the value assigned to each picture. The first worksheet makes that relationship very clear with a winter sticker graph. Each snowflake represents 2 stickers, and students use the graph to answer six questions about penguins, trees, sleighs, and cookies. Questions include finding category totals, identifying the fewest and most stickers, comparing two categories, and finding the total number of stickers represented by the entire graph.
This makes the page useful for checking whether students understand the key rather than simply counting the visible symbols. A row with three snowflakes does not represent three stickers; students must apply the scale and recognize that it represents six.
Different Question Formats Build Flexible Graph Skills
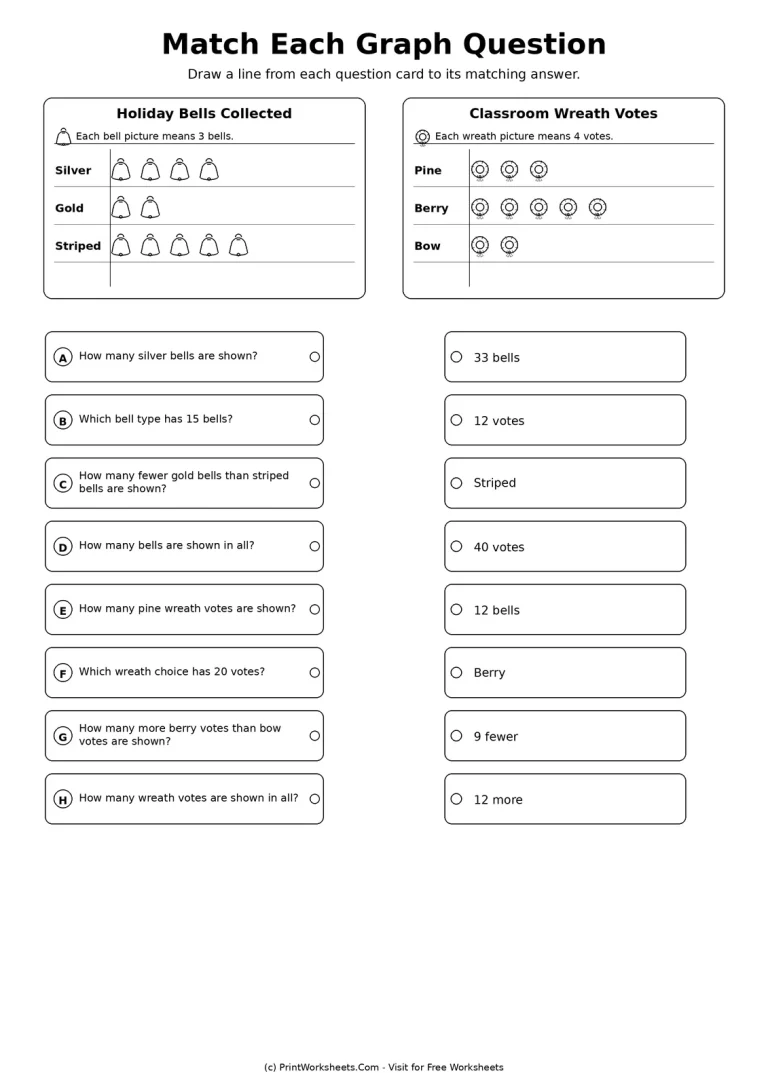
The second worksheet changes the task from written responses to matching. Students read two separate pictographs: Holiday Bells Collected, where each bell picture represents 3 bells, and Classroom Wreath Votes, where each wreath picture represents 4 votes. They then match eight question cards to the correct answer cards. The questions cover exact category values, totals, differences, and category identification, giving students another way to demonstrate the same core skill.
The third page uses multiple-choice questions with two new picture scales. A cocoa cup graph uses 5 cups per picture, and a gift tag graph uses 5 tags per picture. Students answer questions such as how many items a category contains, which category has the least, how many more or fewer are shown, and how many items are represented in all. Because each question includes three answer choices, this page works especially well for independent practice, a quick math center, or a short skills check.
Scaled Pictograph Worksheets with Story Problems
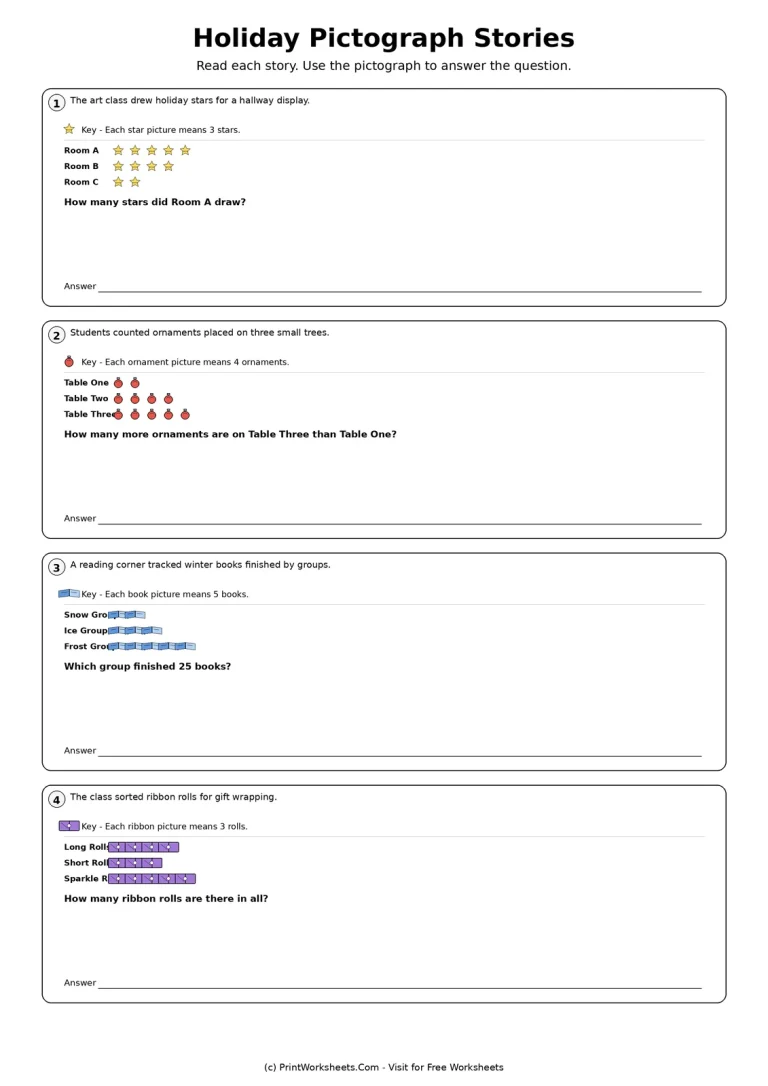
The fourth worksheet places pictographs inside short holiday-themed situations. Students interpret stars drawn by an art class, ornaments counted on small trees, winter books finished by reading groups, and ribbon rolls sorted for gift wrapping. The picture keys vary by problem: stars represent 3, ornaments represent 4, books represent 5, and ribbon pictures represent 3 rolls. Students must use the correct scale for each individual story before writing an answer.
This page adds an important layer of comprehension because students need to connect a short context, a visual data display, and a mathematical question. Problems ask for a category amount, a comparison between two groups, identification of the group representing 25 books, and a total across several ribbon categories.
Skills Practiced Across the Worksheet Set
Together, the four pages reinforce several connected Grade 2 data skills. Students practice interpreting a pictograph key, using repeated addition or skip counting, comparing quantities, calculating differences, finding combined totals, and selecting information from a graph to answer a specific question. The changing scales also discourage students from assuming that every picture always has the same value.
If students are also working with other visual data displays, the Grade 2 bar graph worksheets provide a natural next comparison because students can answer similar data questions from bars instead of picture symbols. For measurement data organized along a number line, use the Grade 2 line plot worksheets.
Ways to Use These Pictograph Questions
The pages can be assigned in sequence or selected by question type. Begin with the single winter pictograph when introducing scale keys, move to the matching page for guided practice, use the multiple-choice page for independent work, and finish with the story problems when students are ready to apply pictograph reading in context. The variety makes the set practical for classroom lessons, math centers, review, homework, or extra practice while keeping the mathematical focus consistent from page to page.