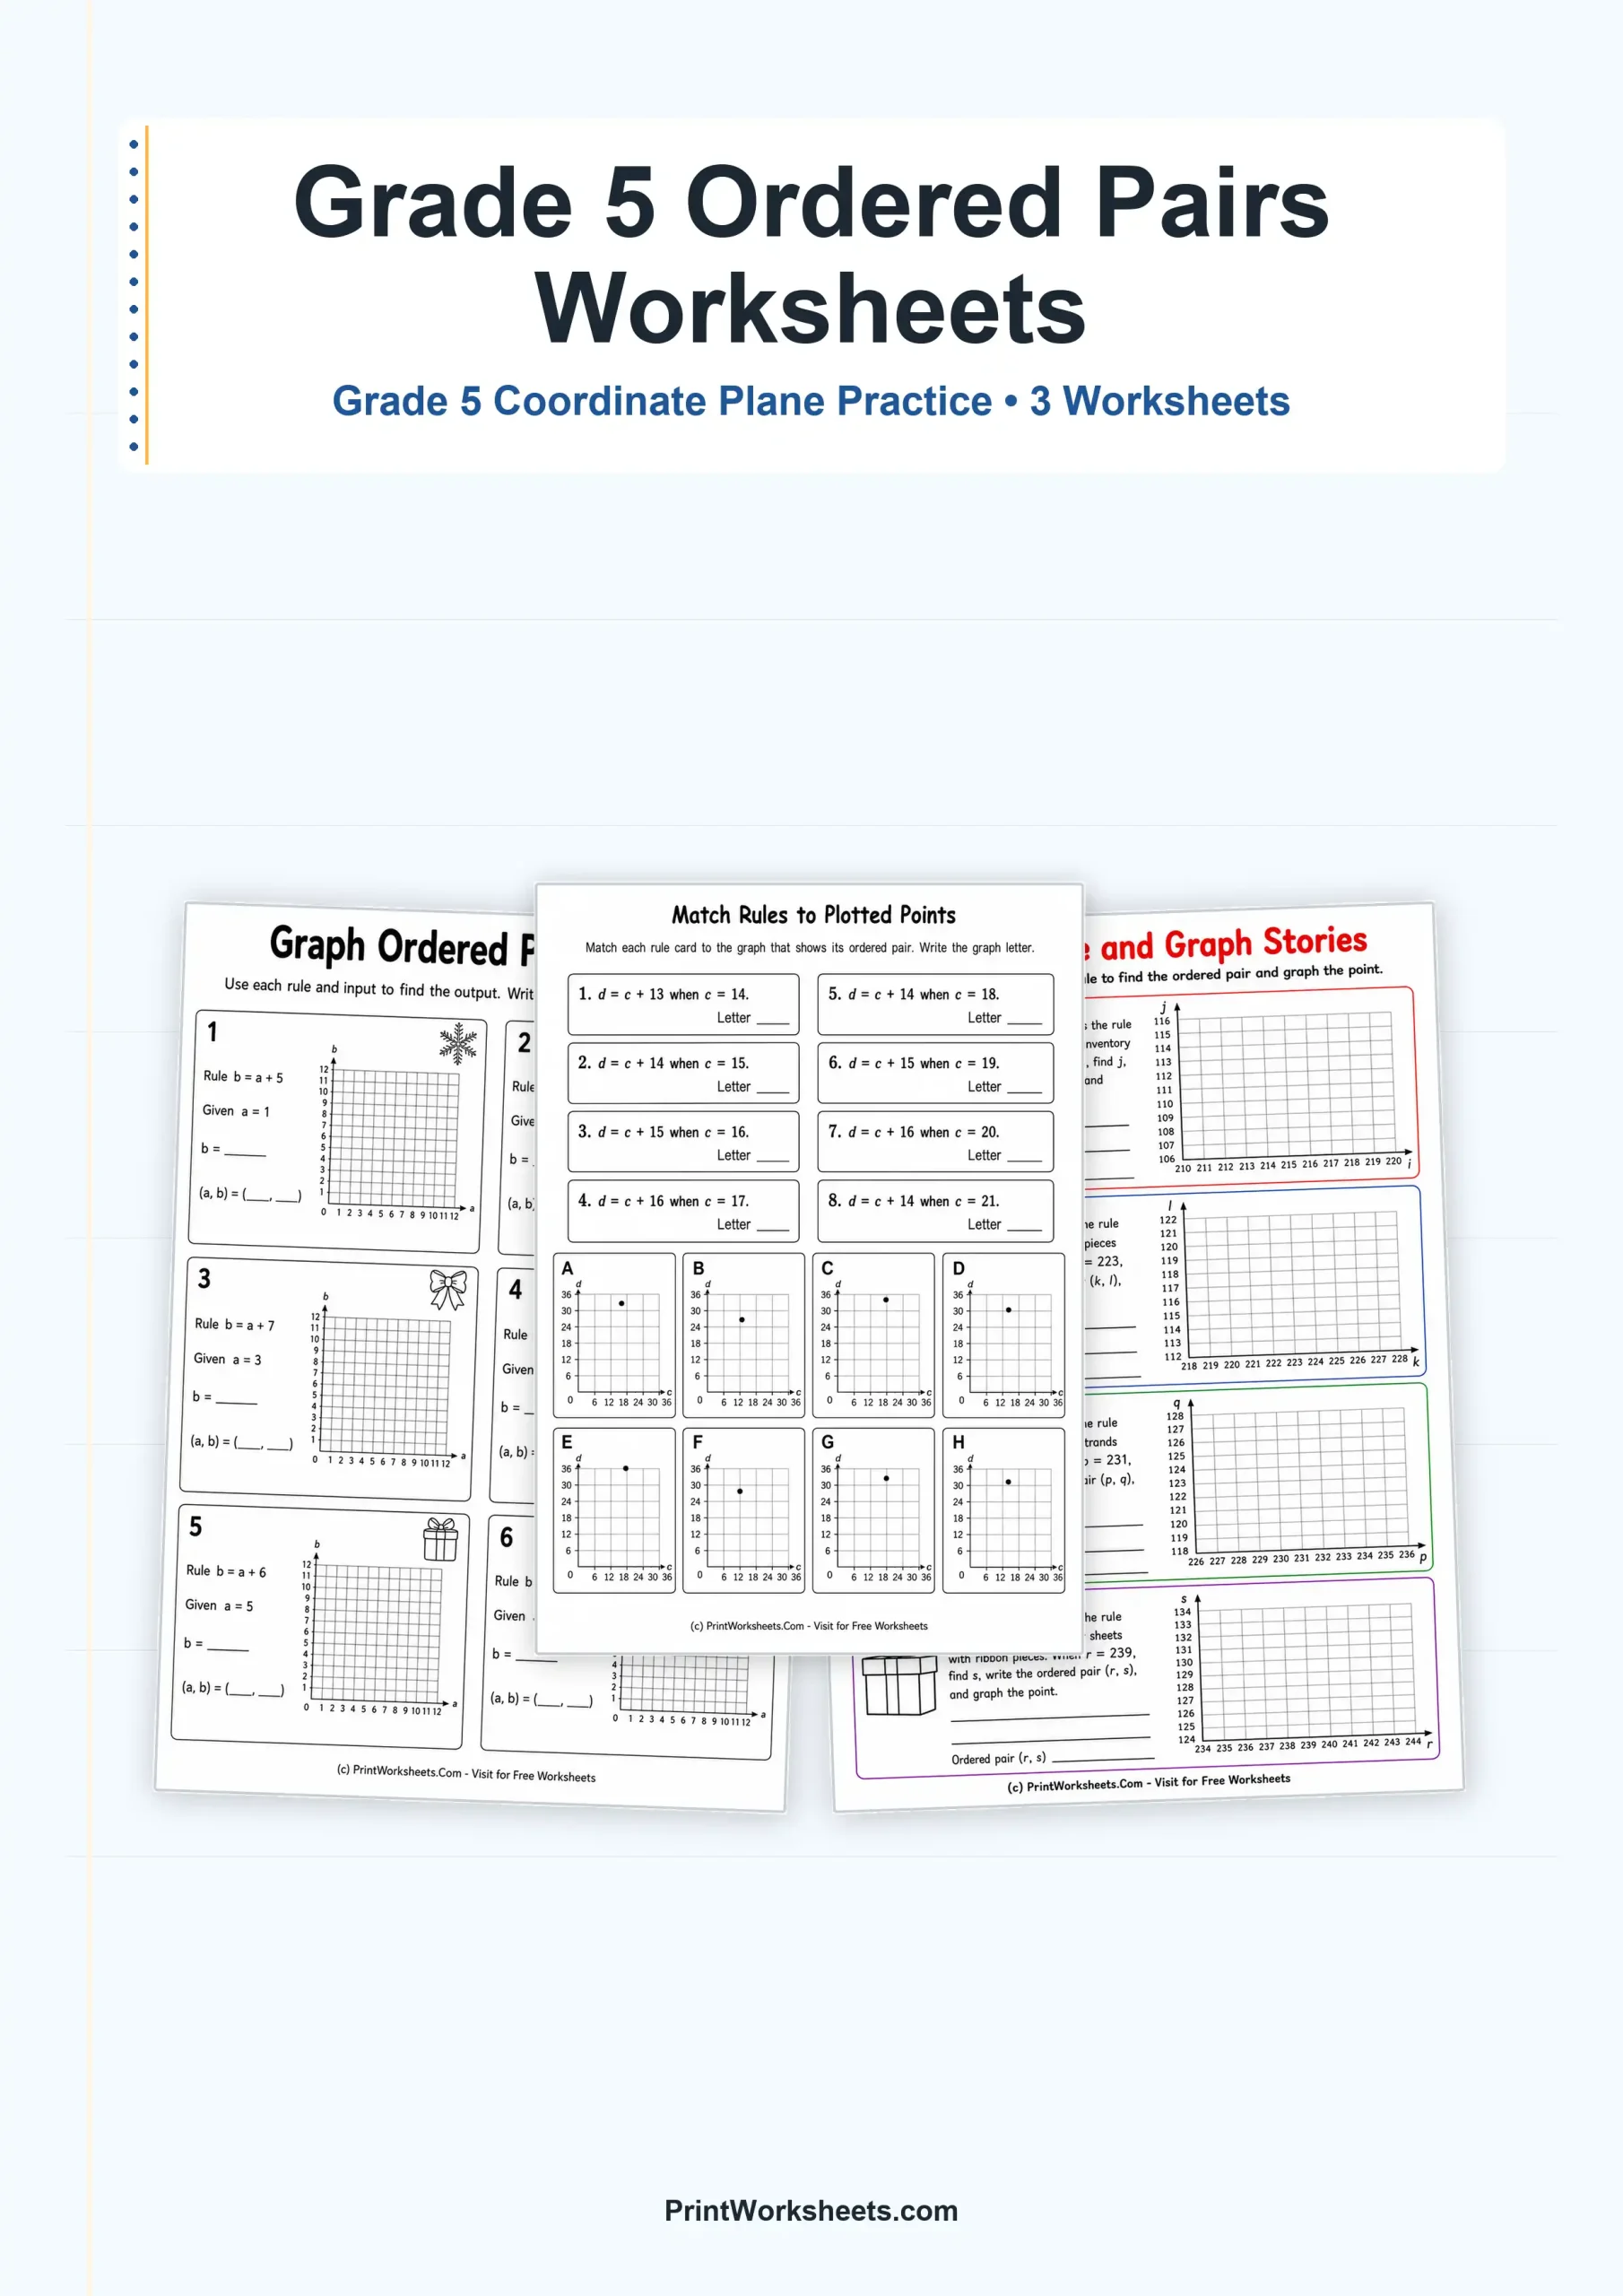
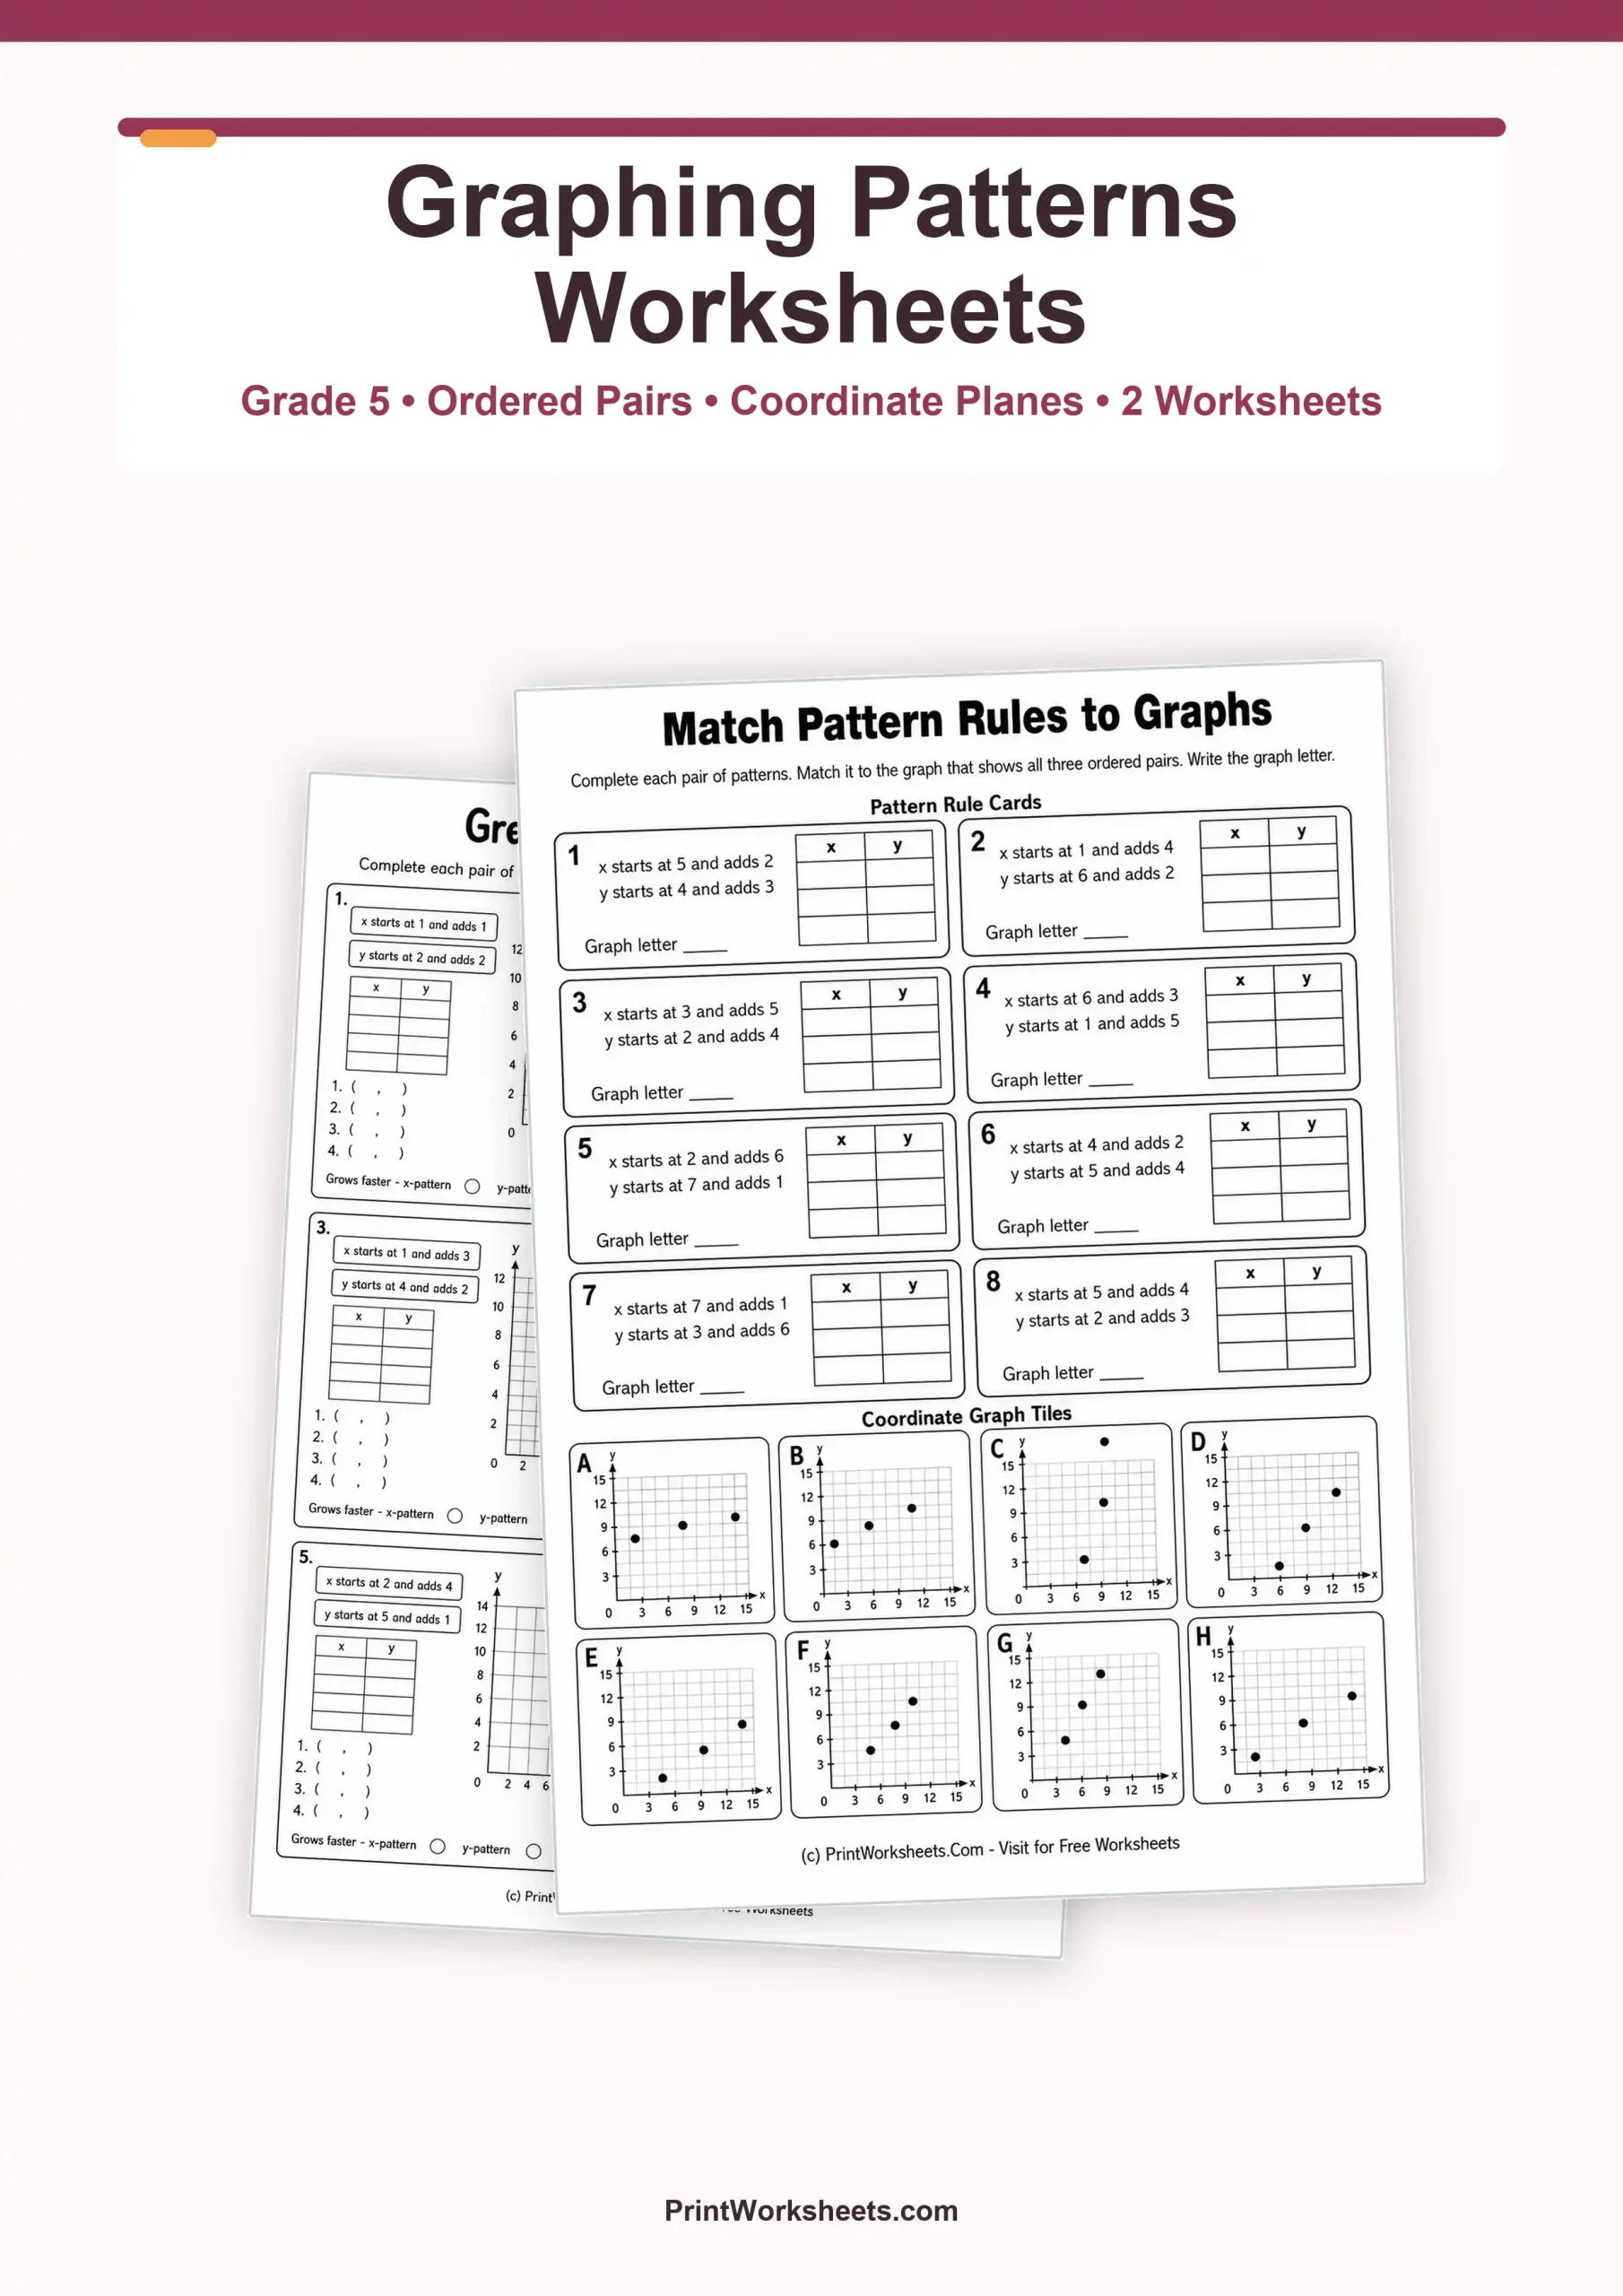
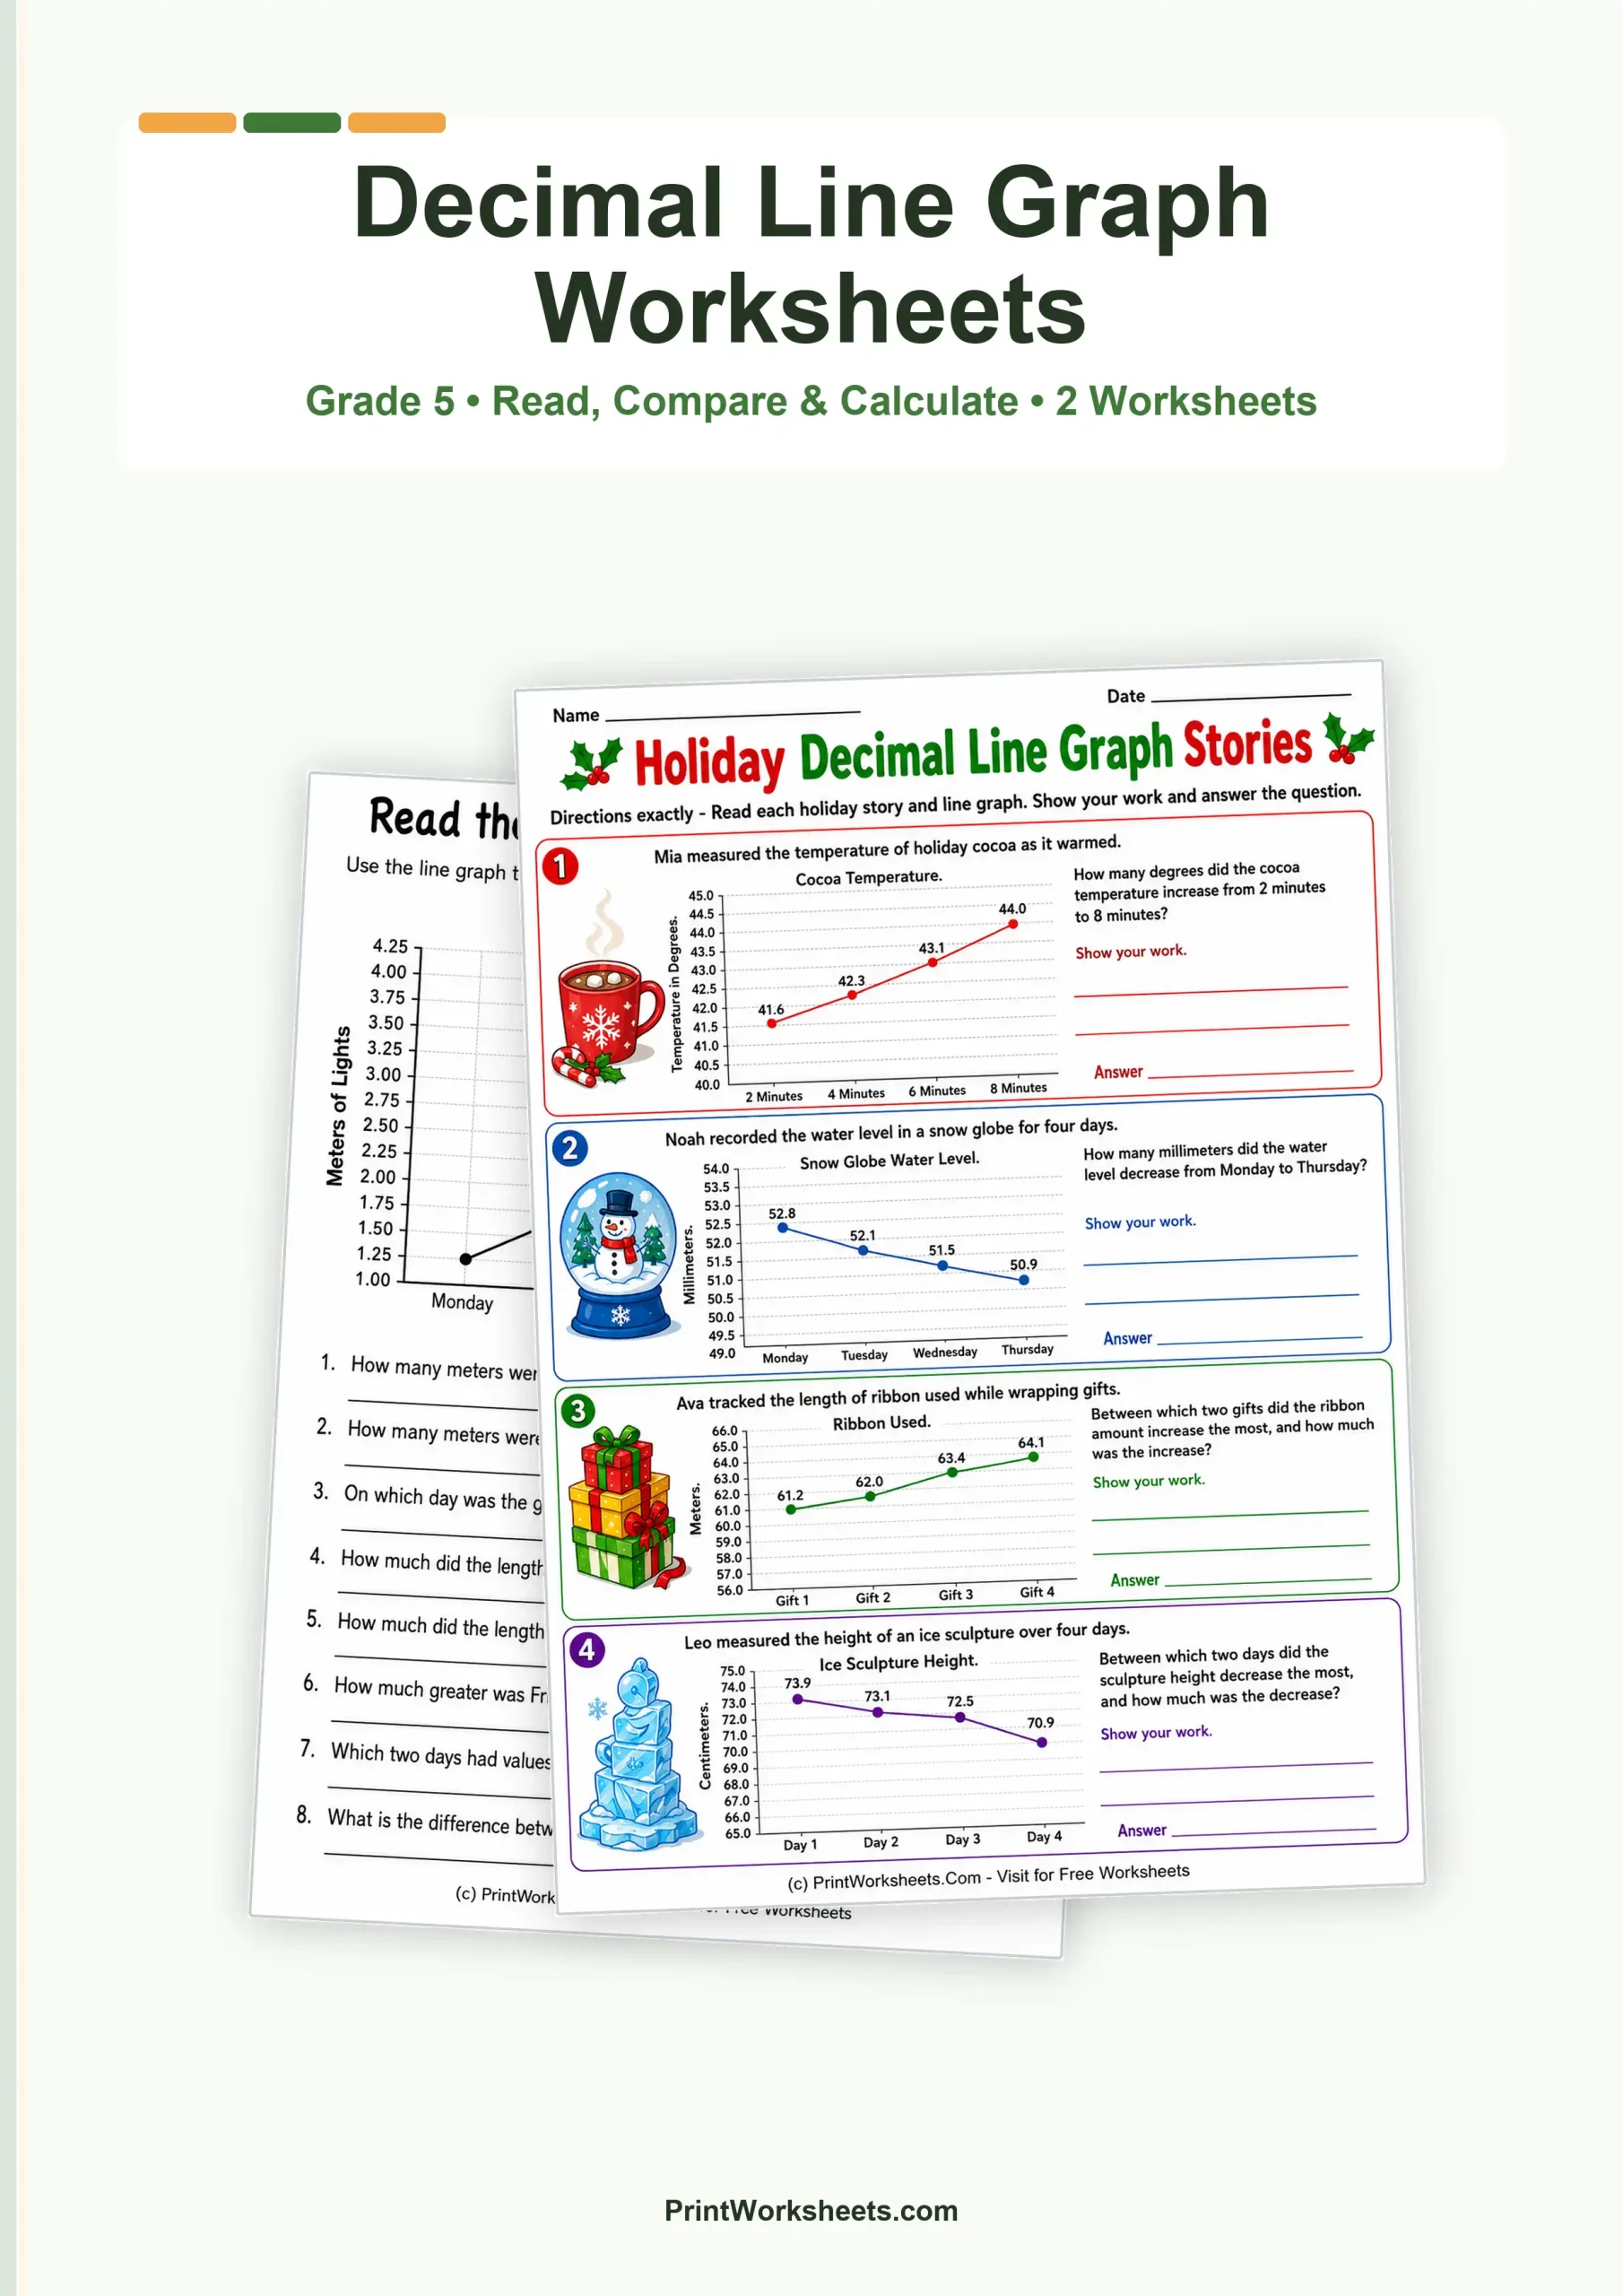
Making Math Visual: Why Data and Graphing Skills Matter
Data and graphing transform abstract math concepts into visual stories. For elementary students, learning how to collect, organize, and interpret data is a critical STEM skill. Our free printable data and graphing worksheets are designed to take the fear out of charts and graphs, turning young learners into confident data analysts. Whether your student is just starting with picture graphs or ready to master line plots, these engaging activities provide the perfect practice ground.
What Types of Data and Graphing Worksheets Are Included?
We offer a comprehensive library of printable activities that progress in difficulty, ensuring mastery at every grade level. Our collection covers the core types of data visualization required in K-5 math curriculums. You will find worksheets dedicated to:
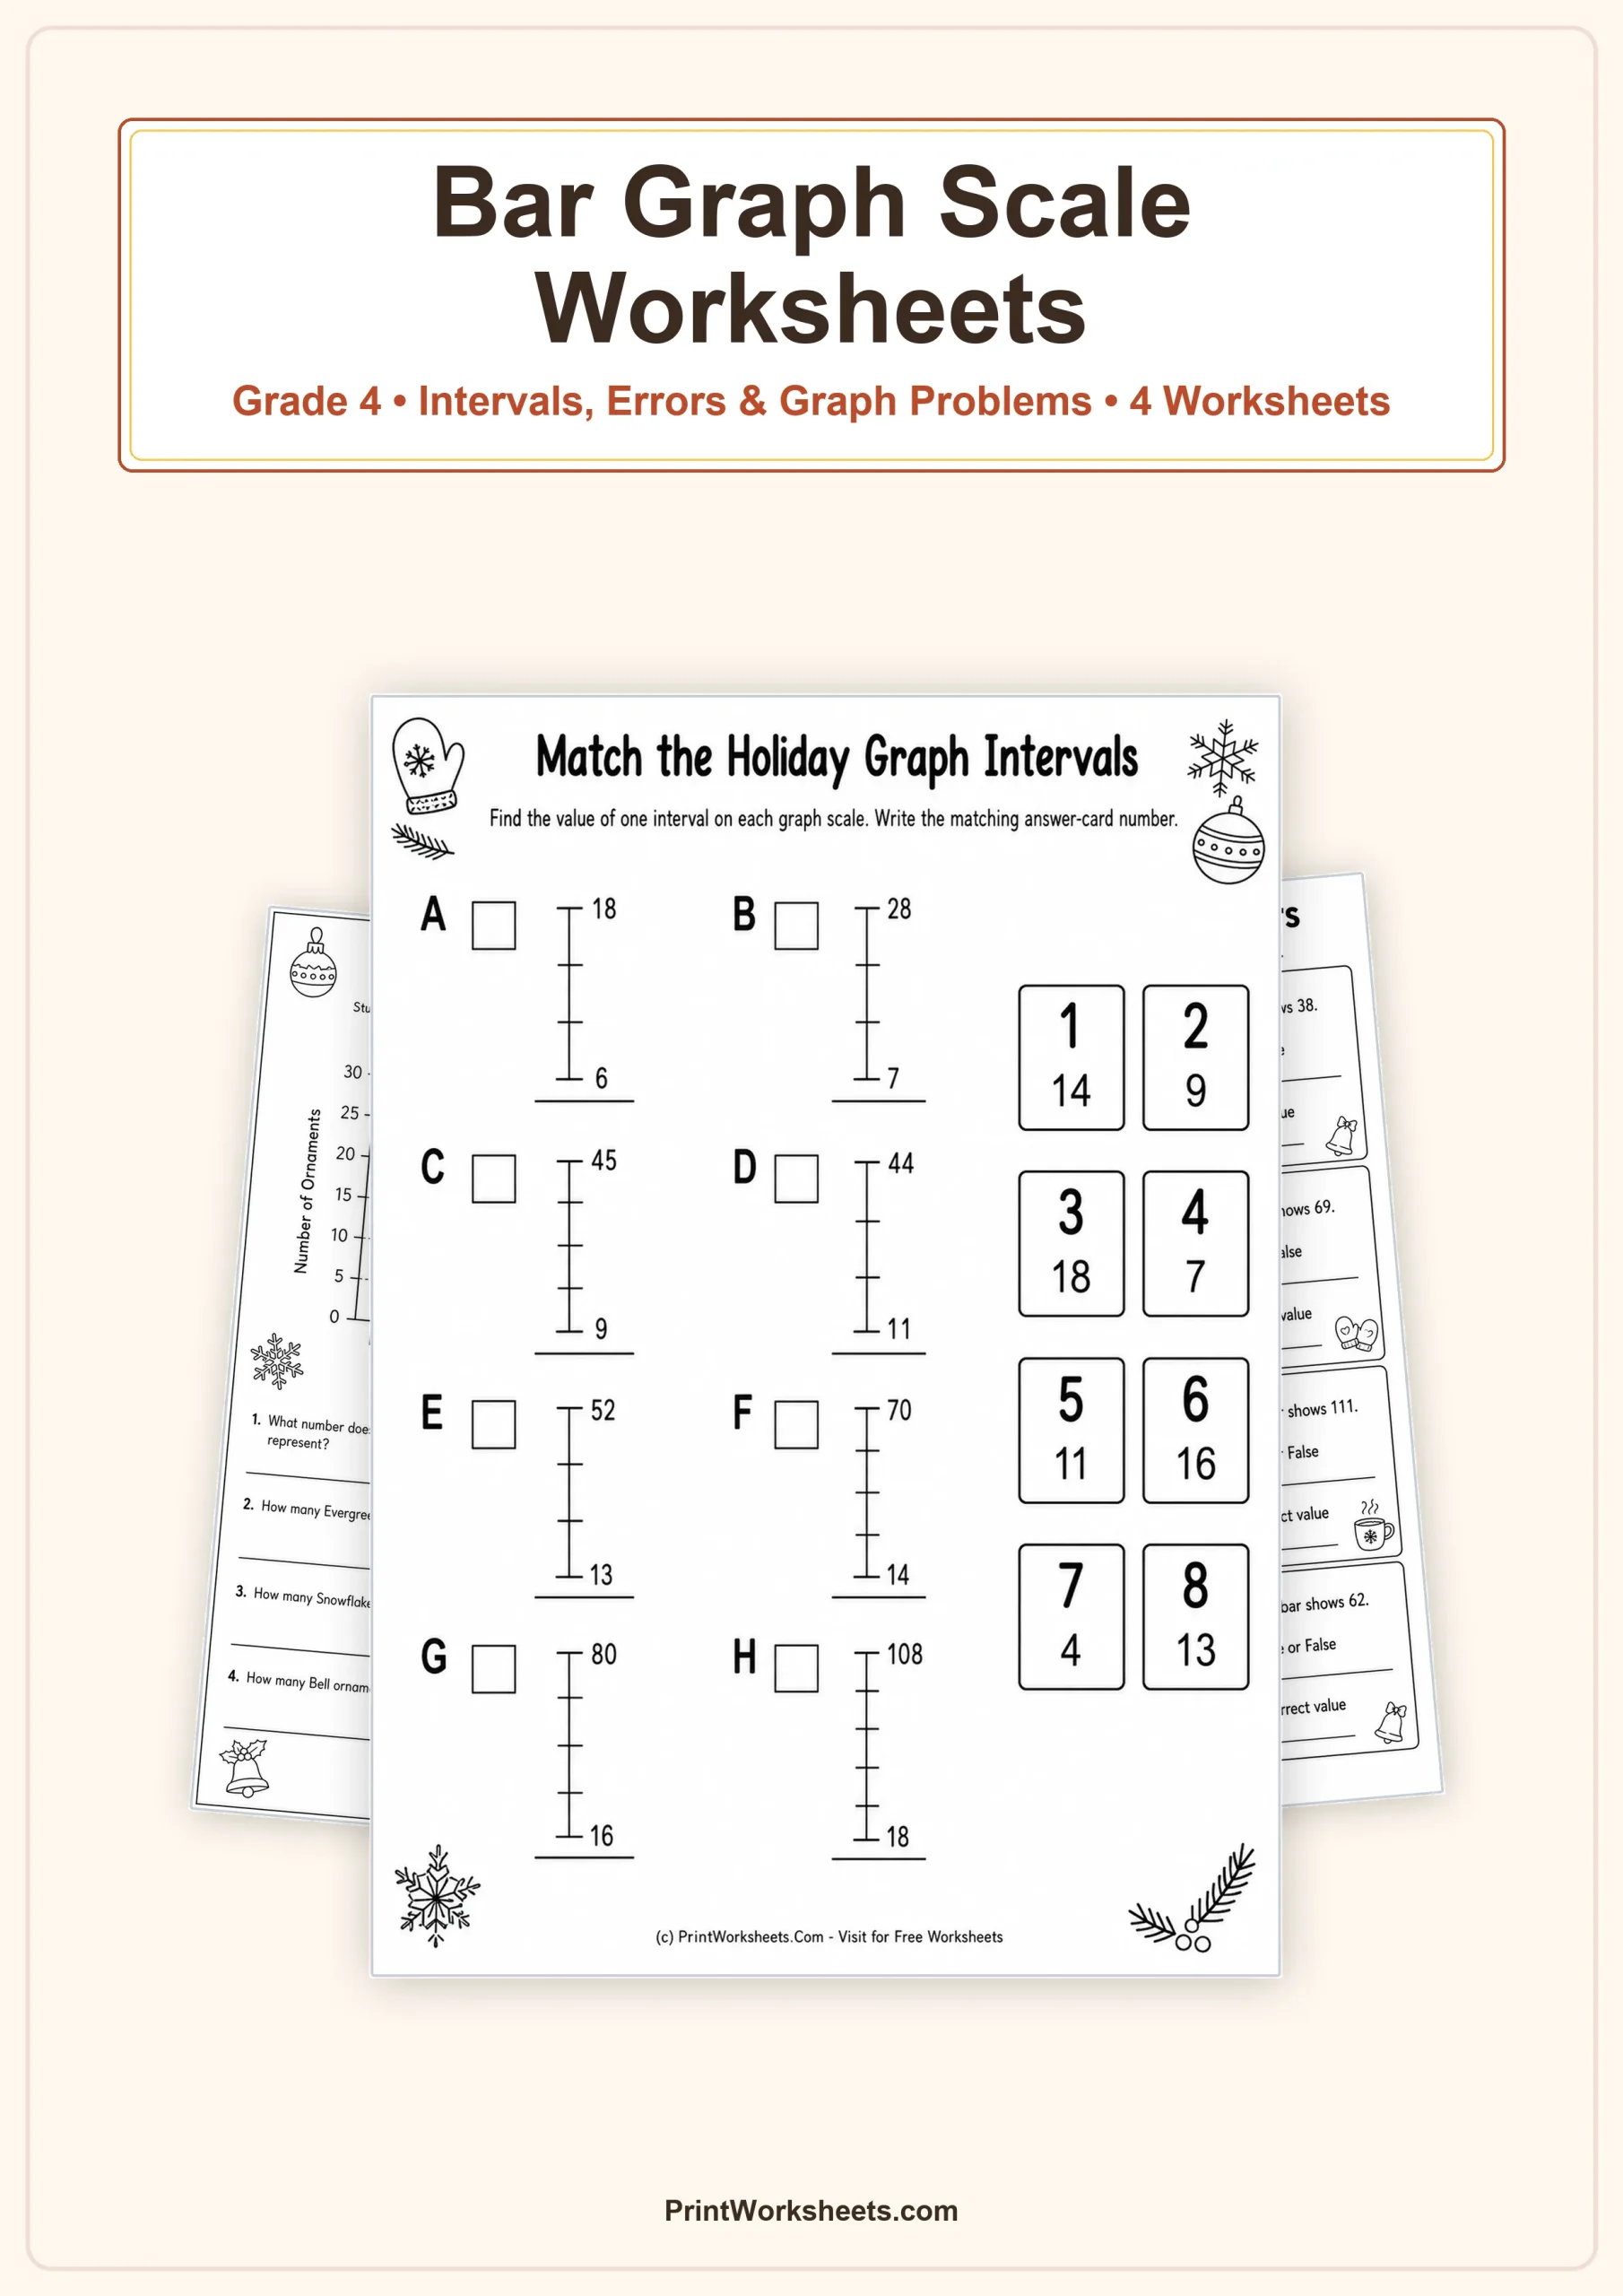
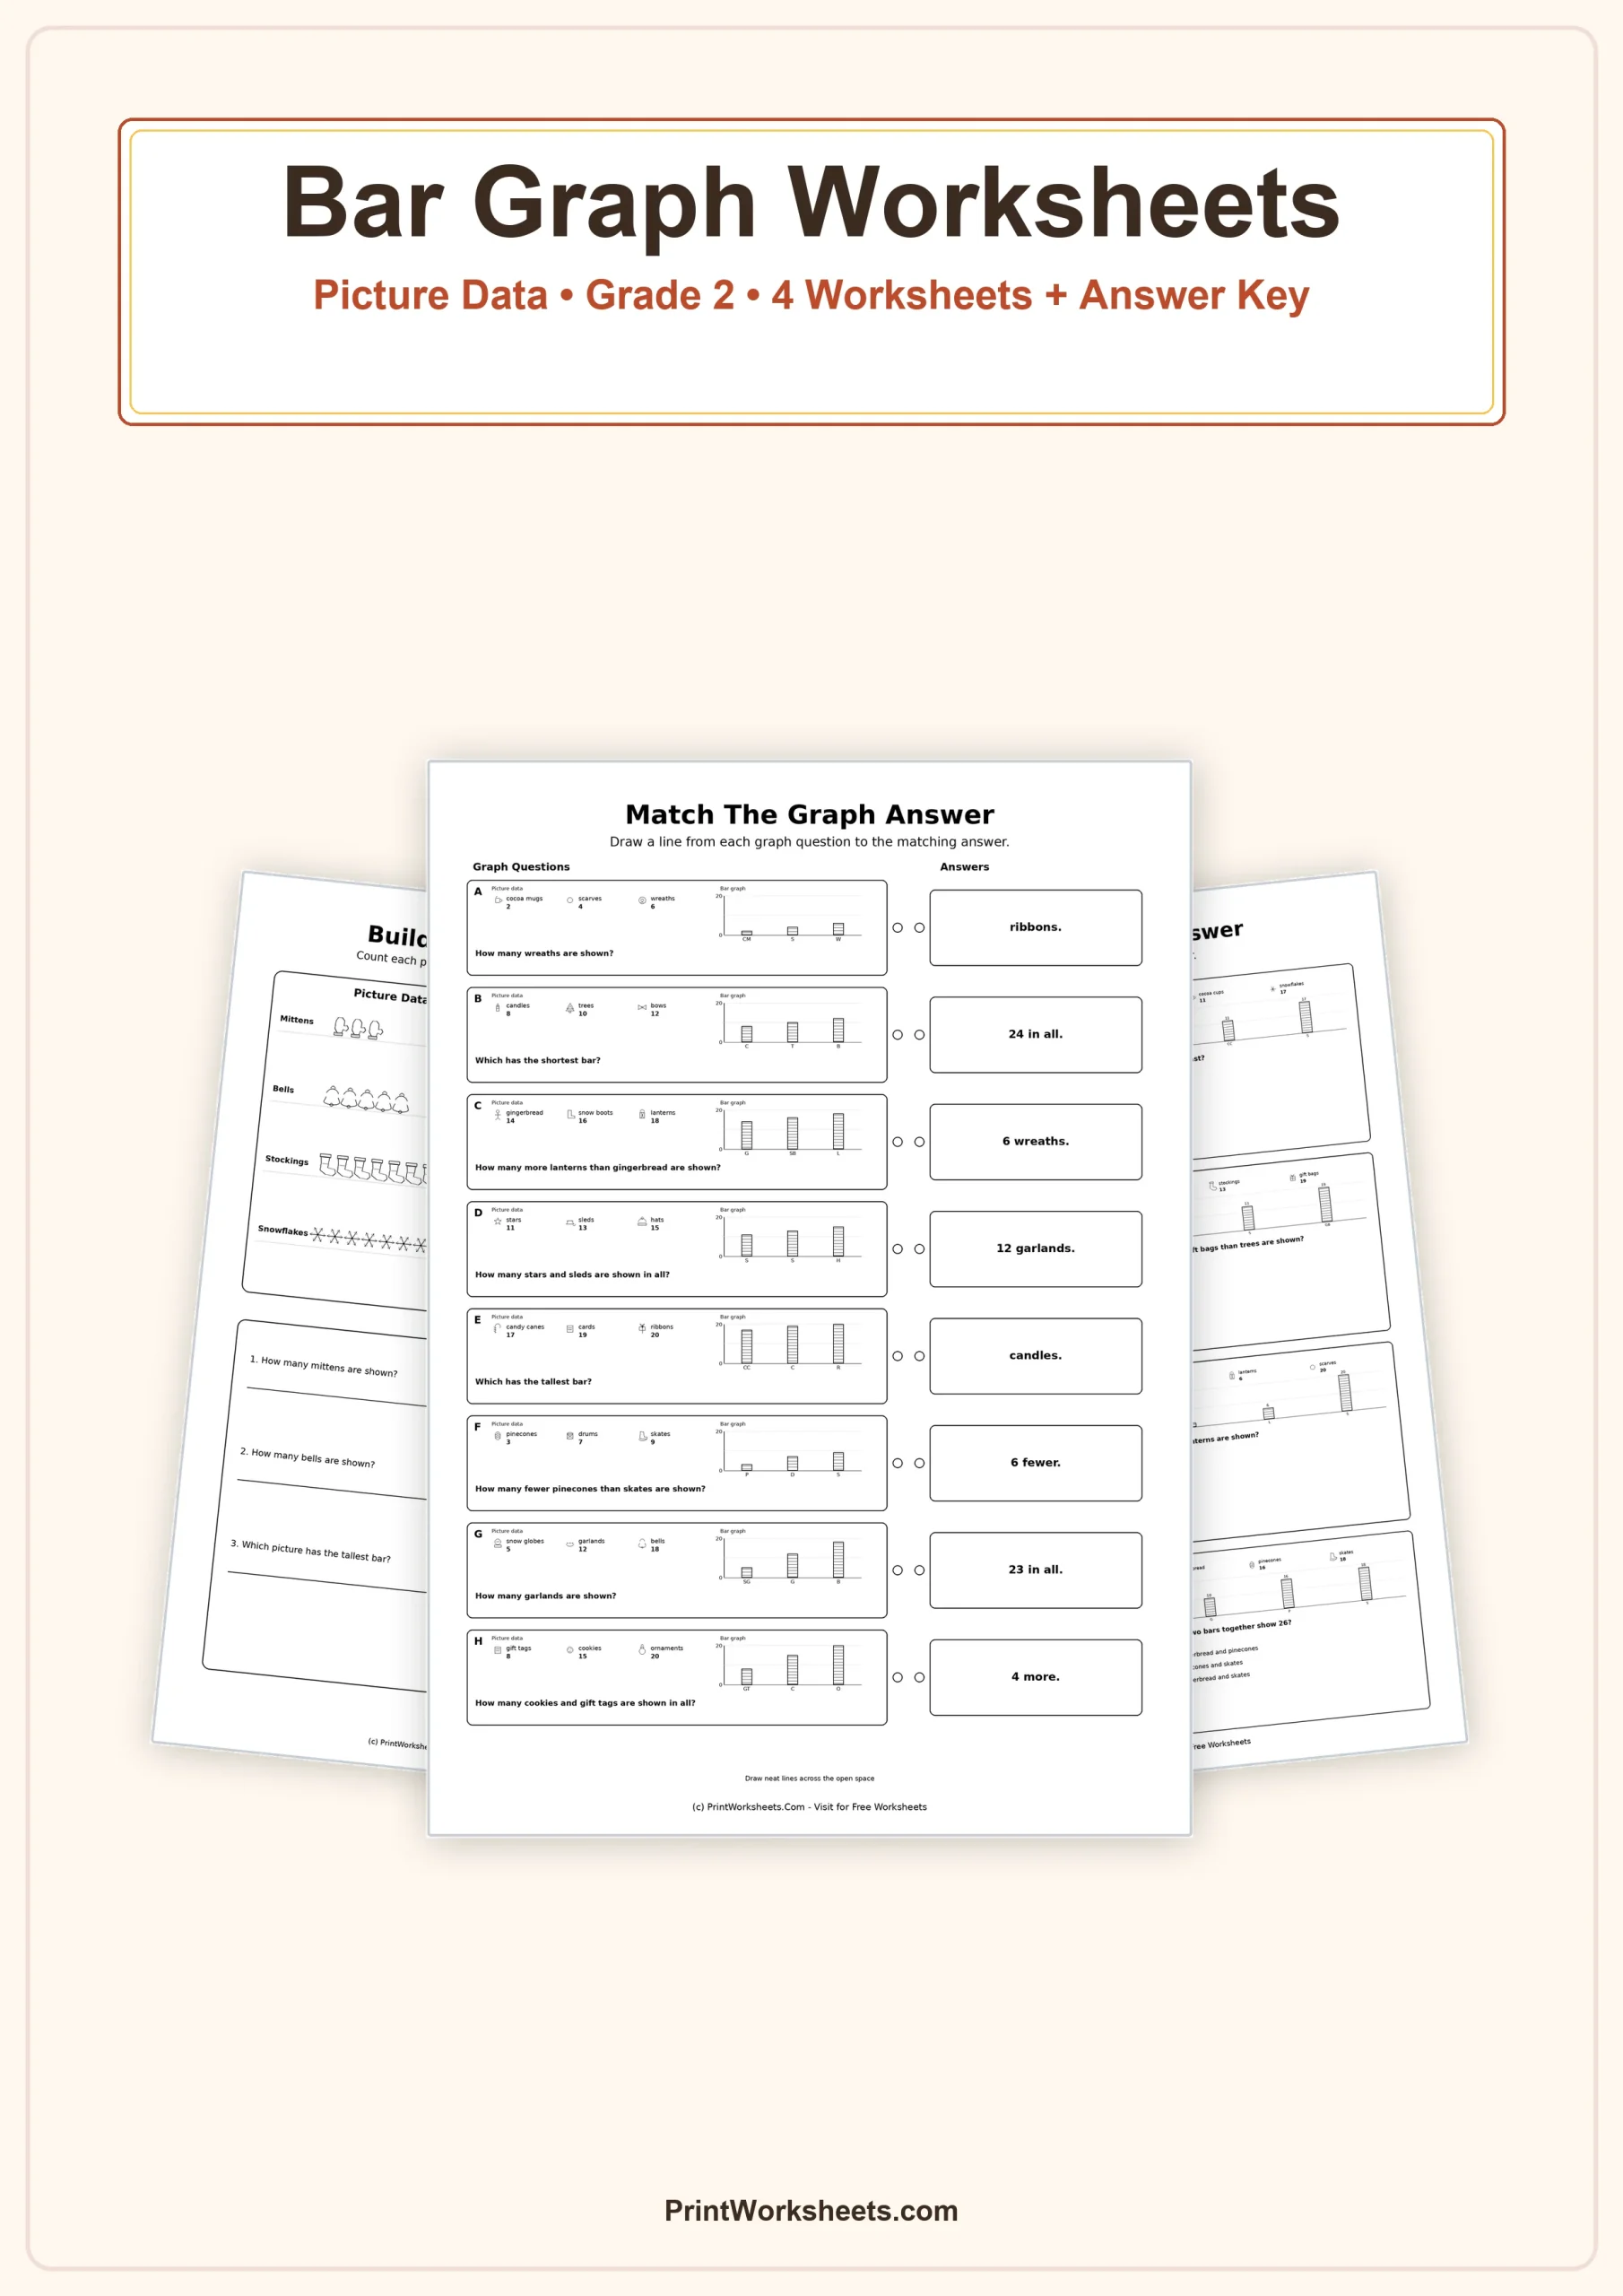
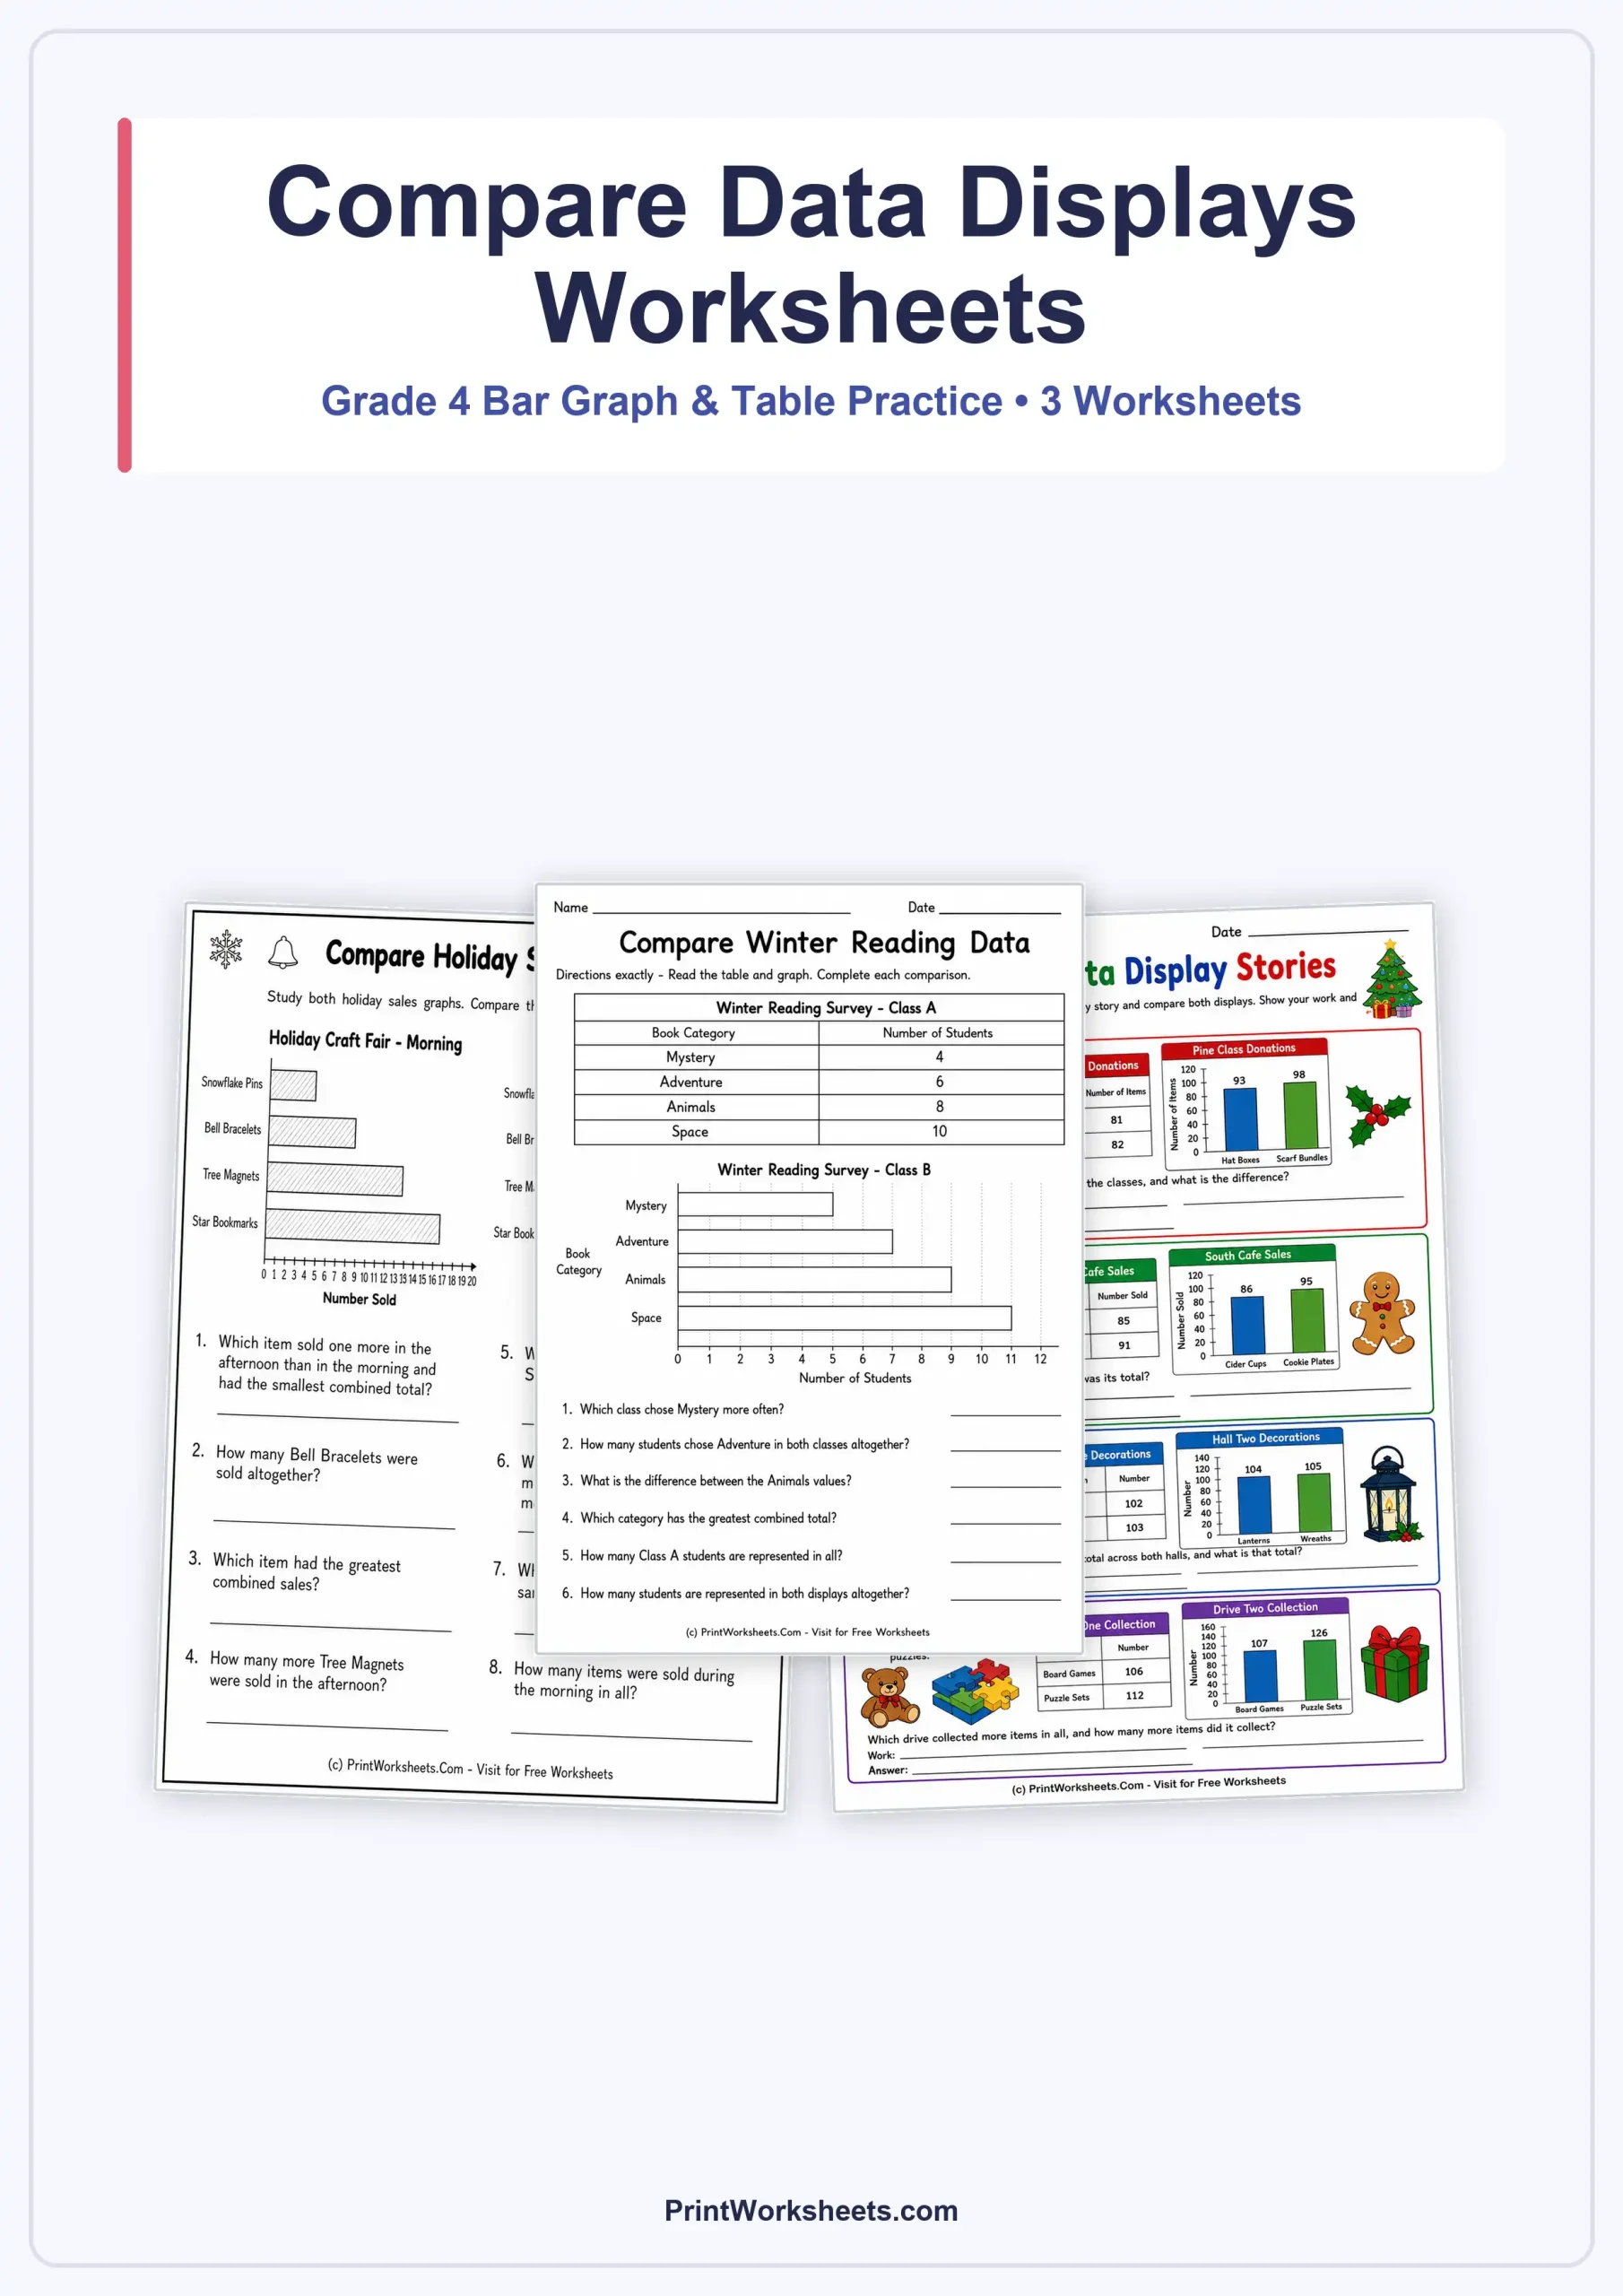
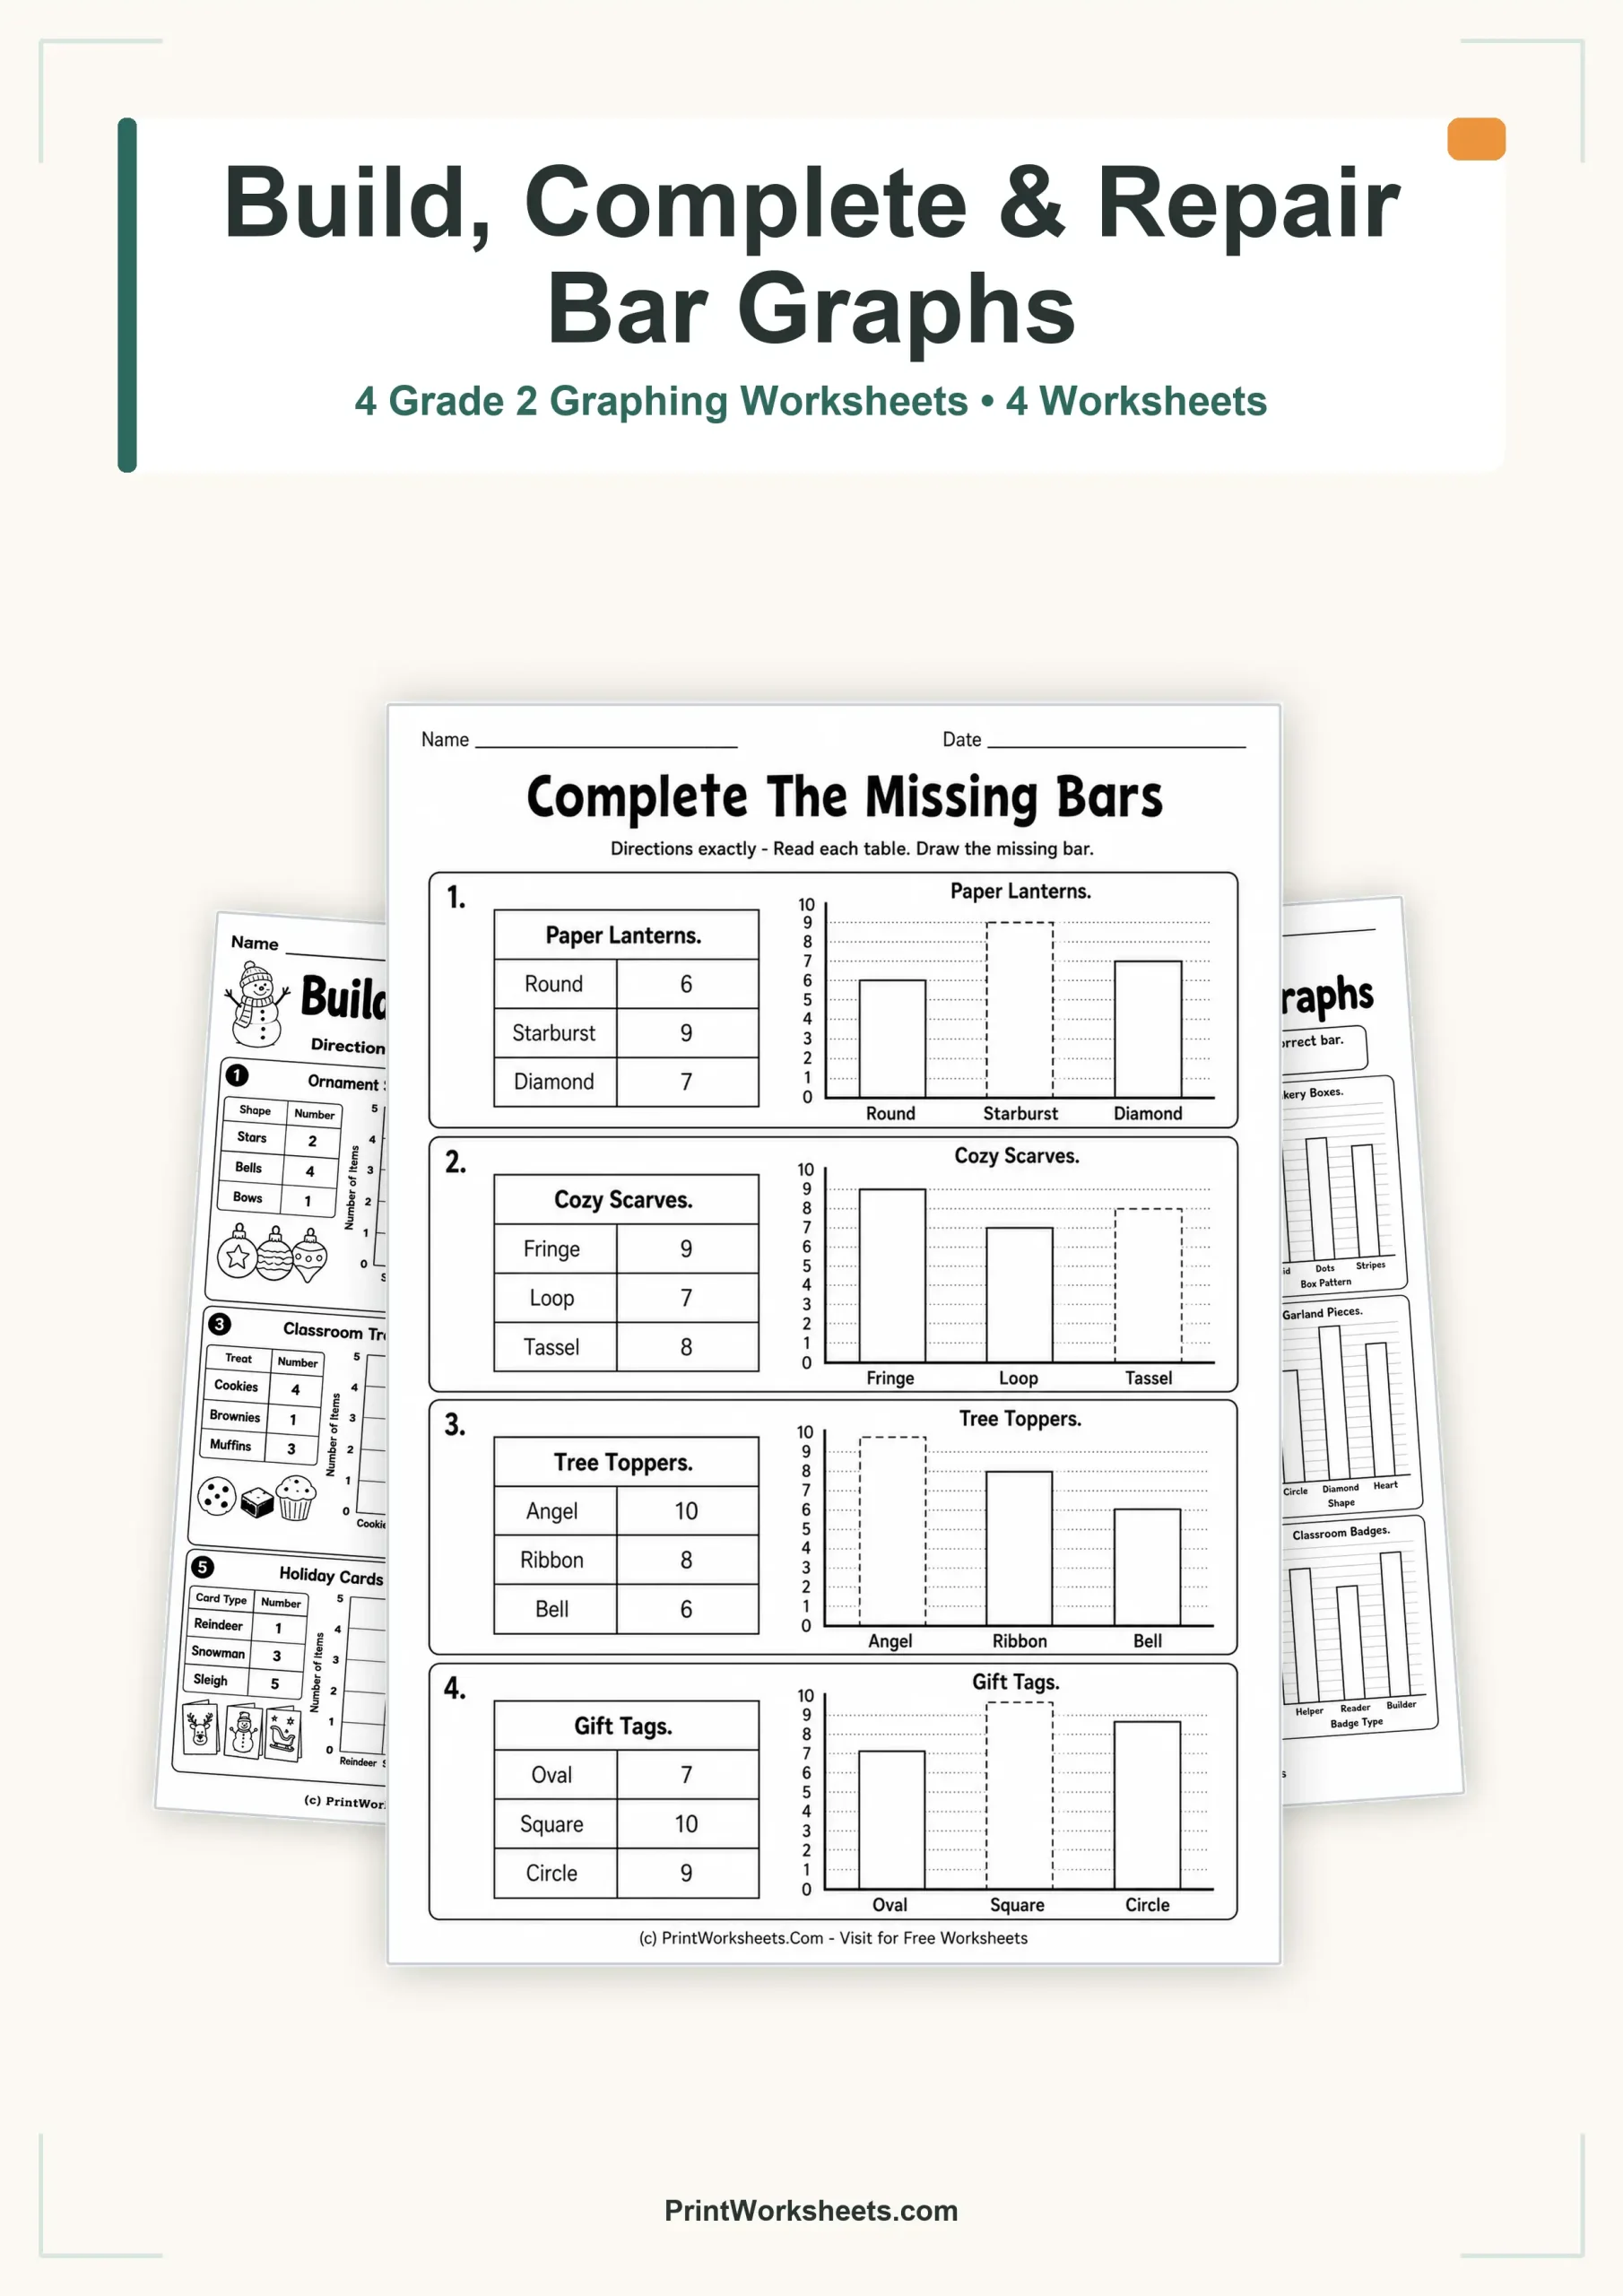
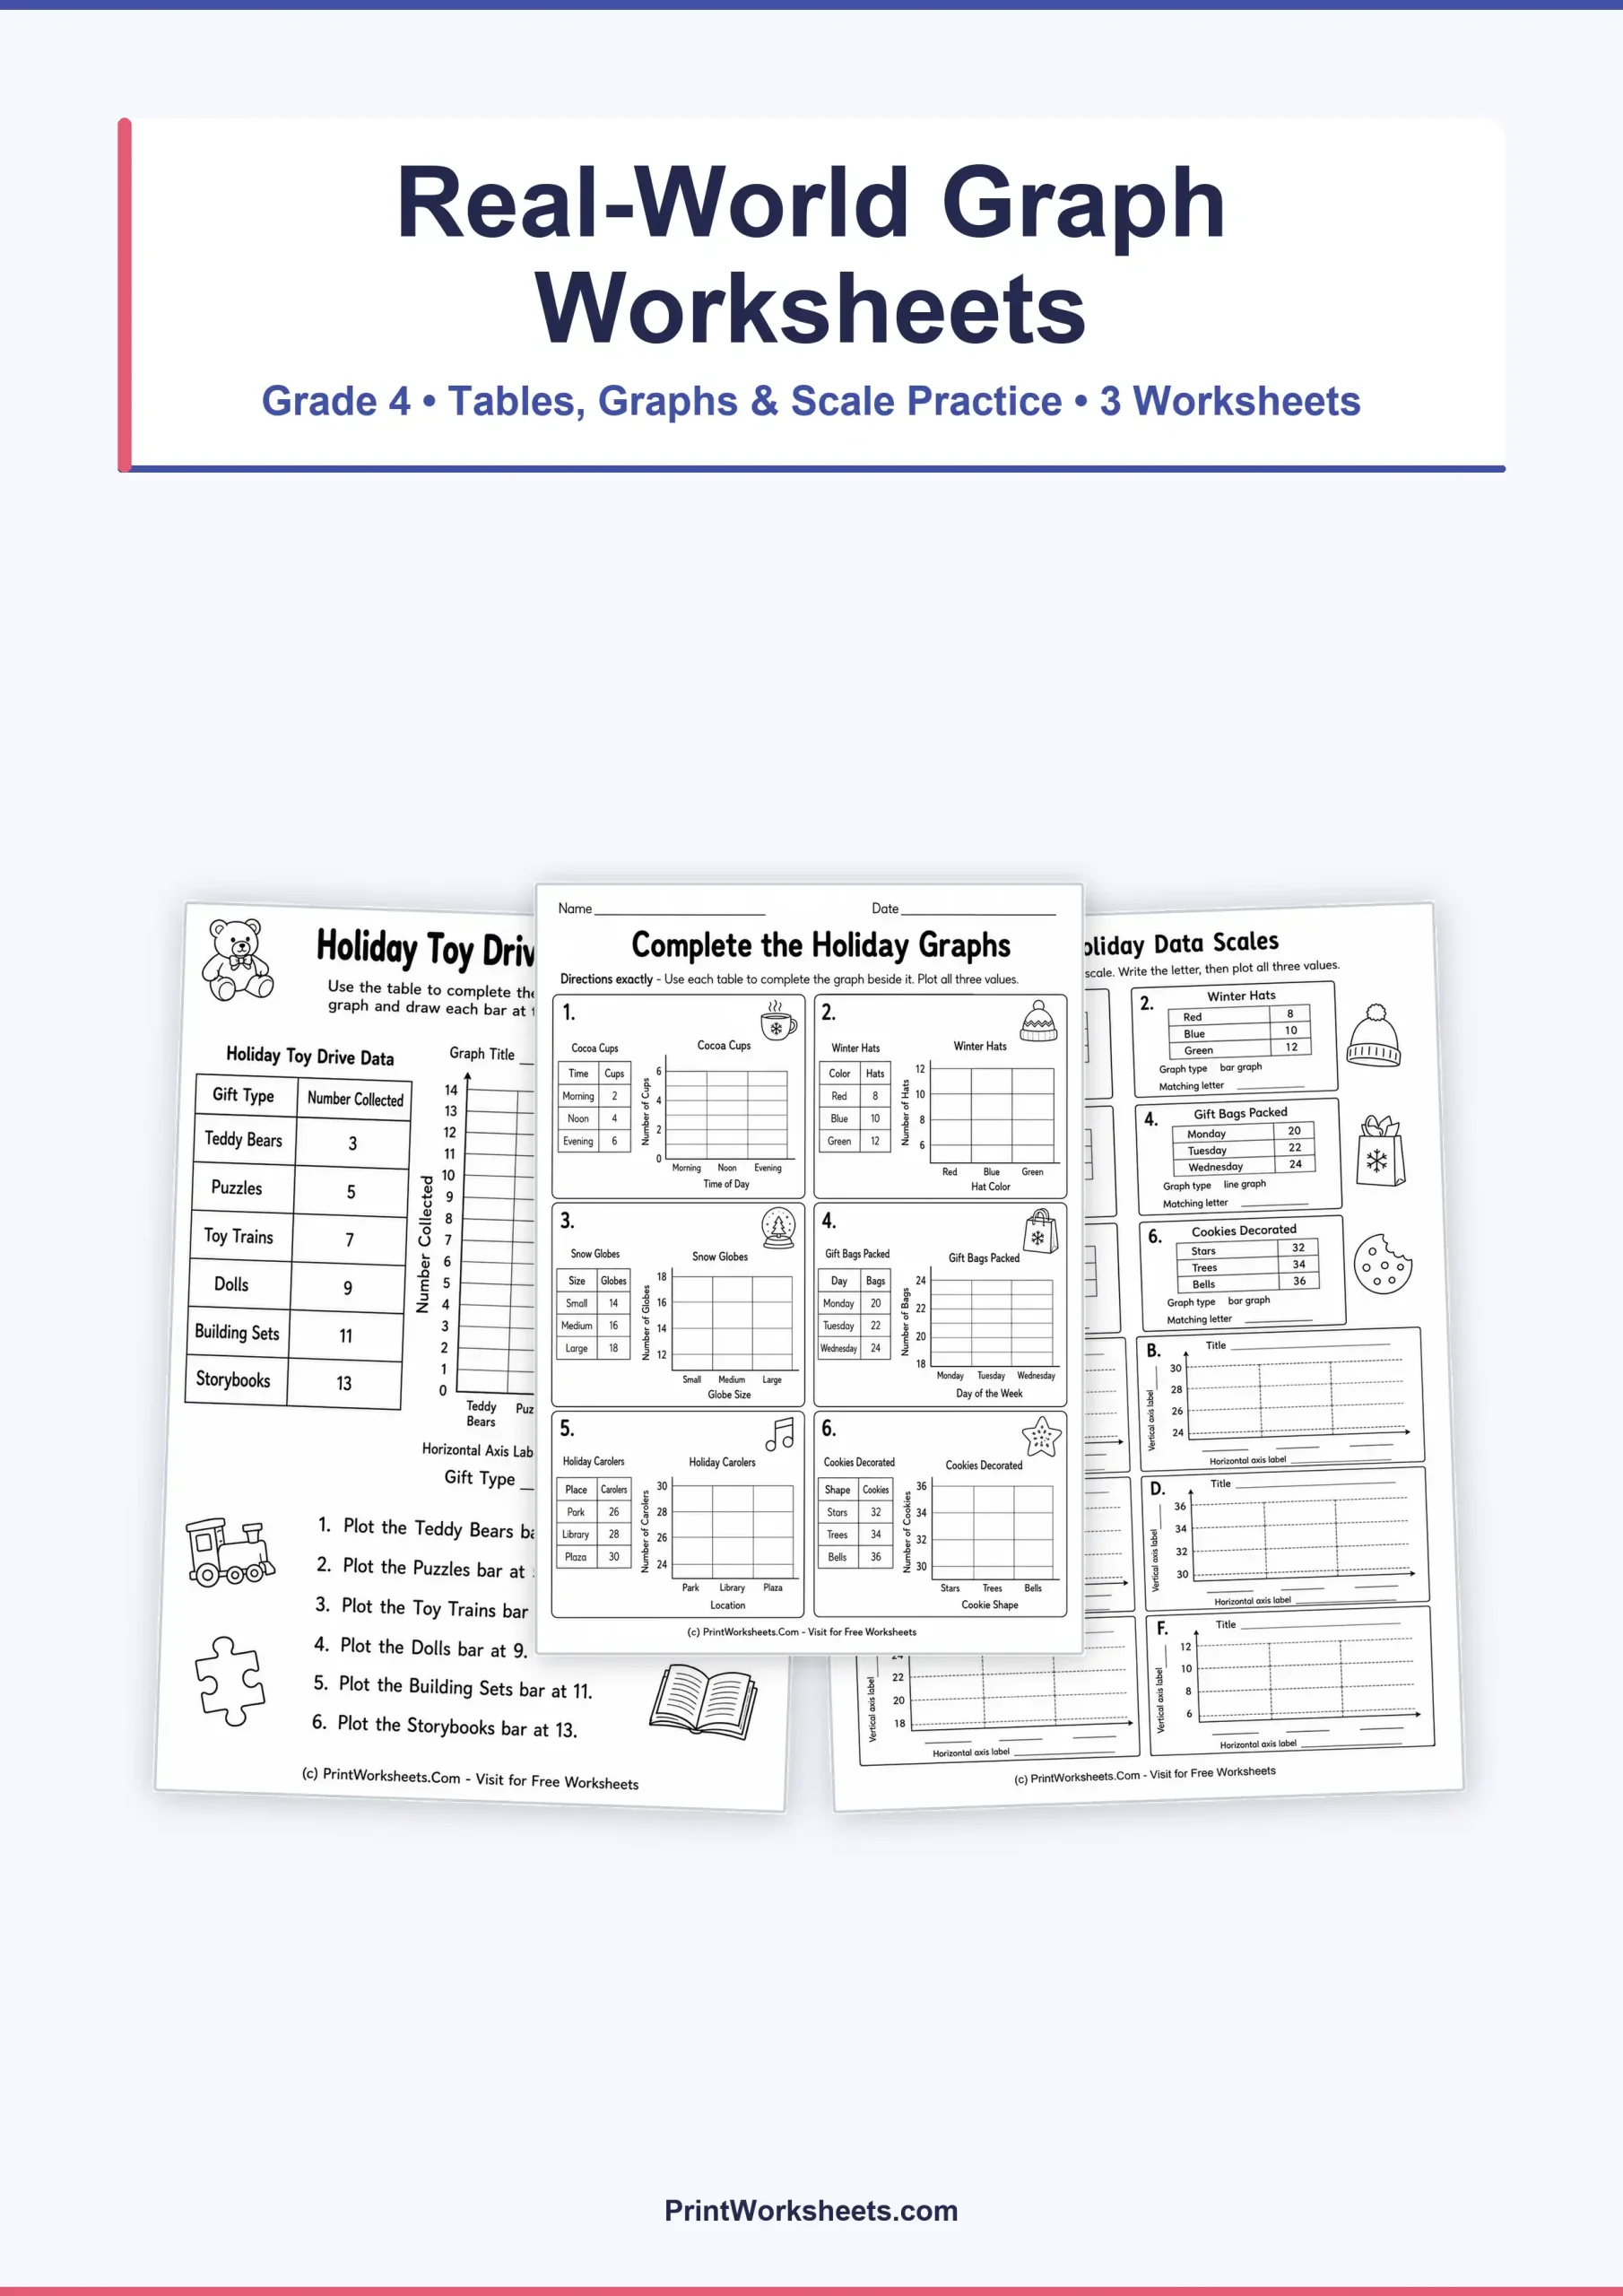
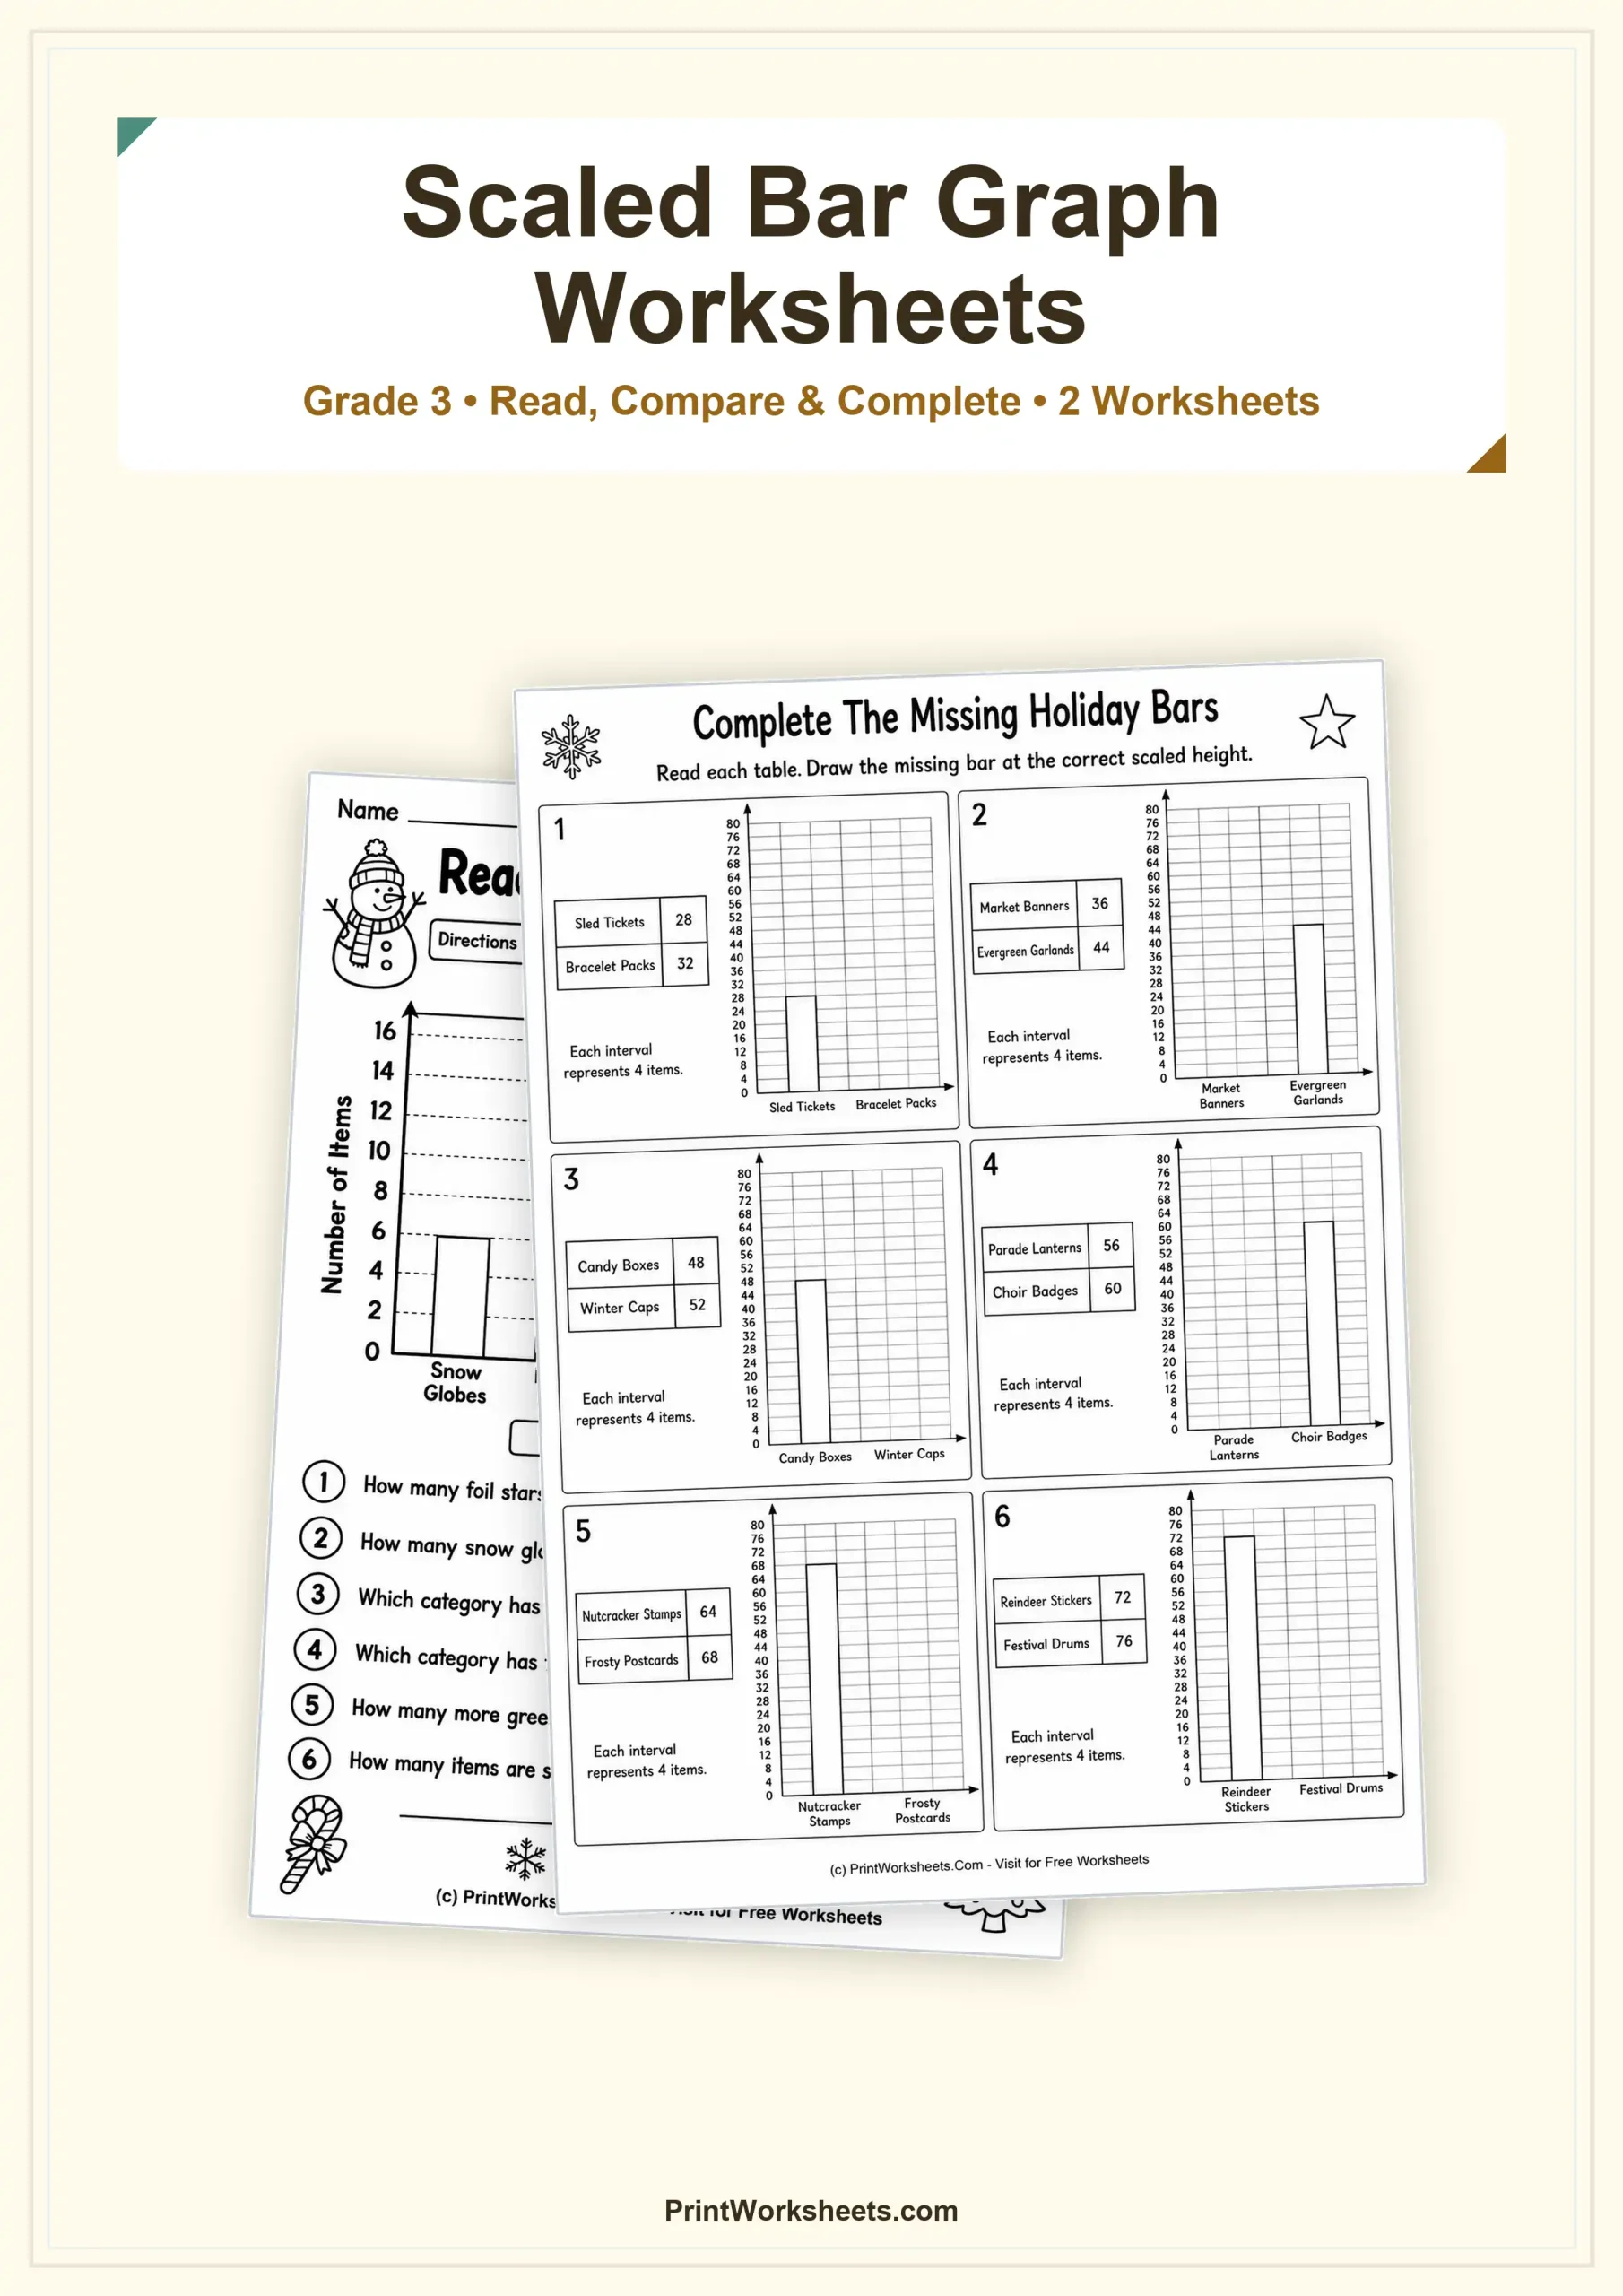
- Bar Graph Worksheets: Help kids compare data with clear, colorful bars. Perfect for visualizing survey results or counting objects.
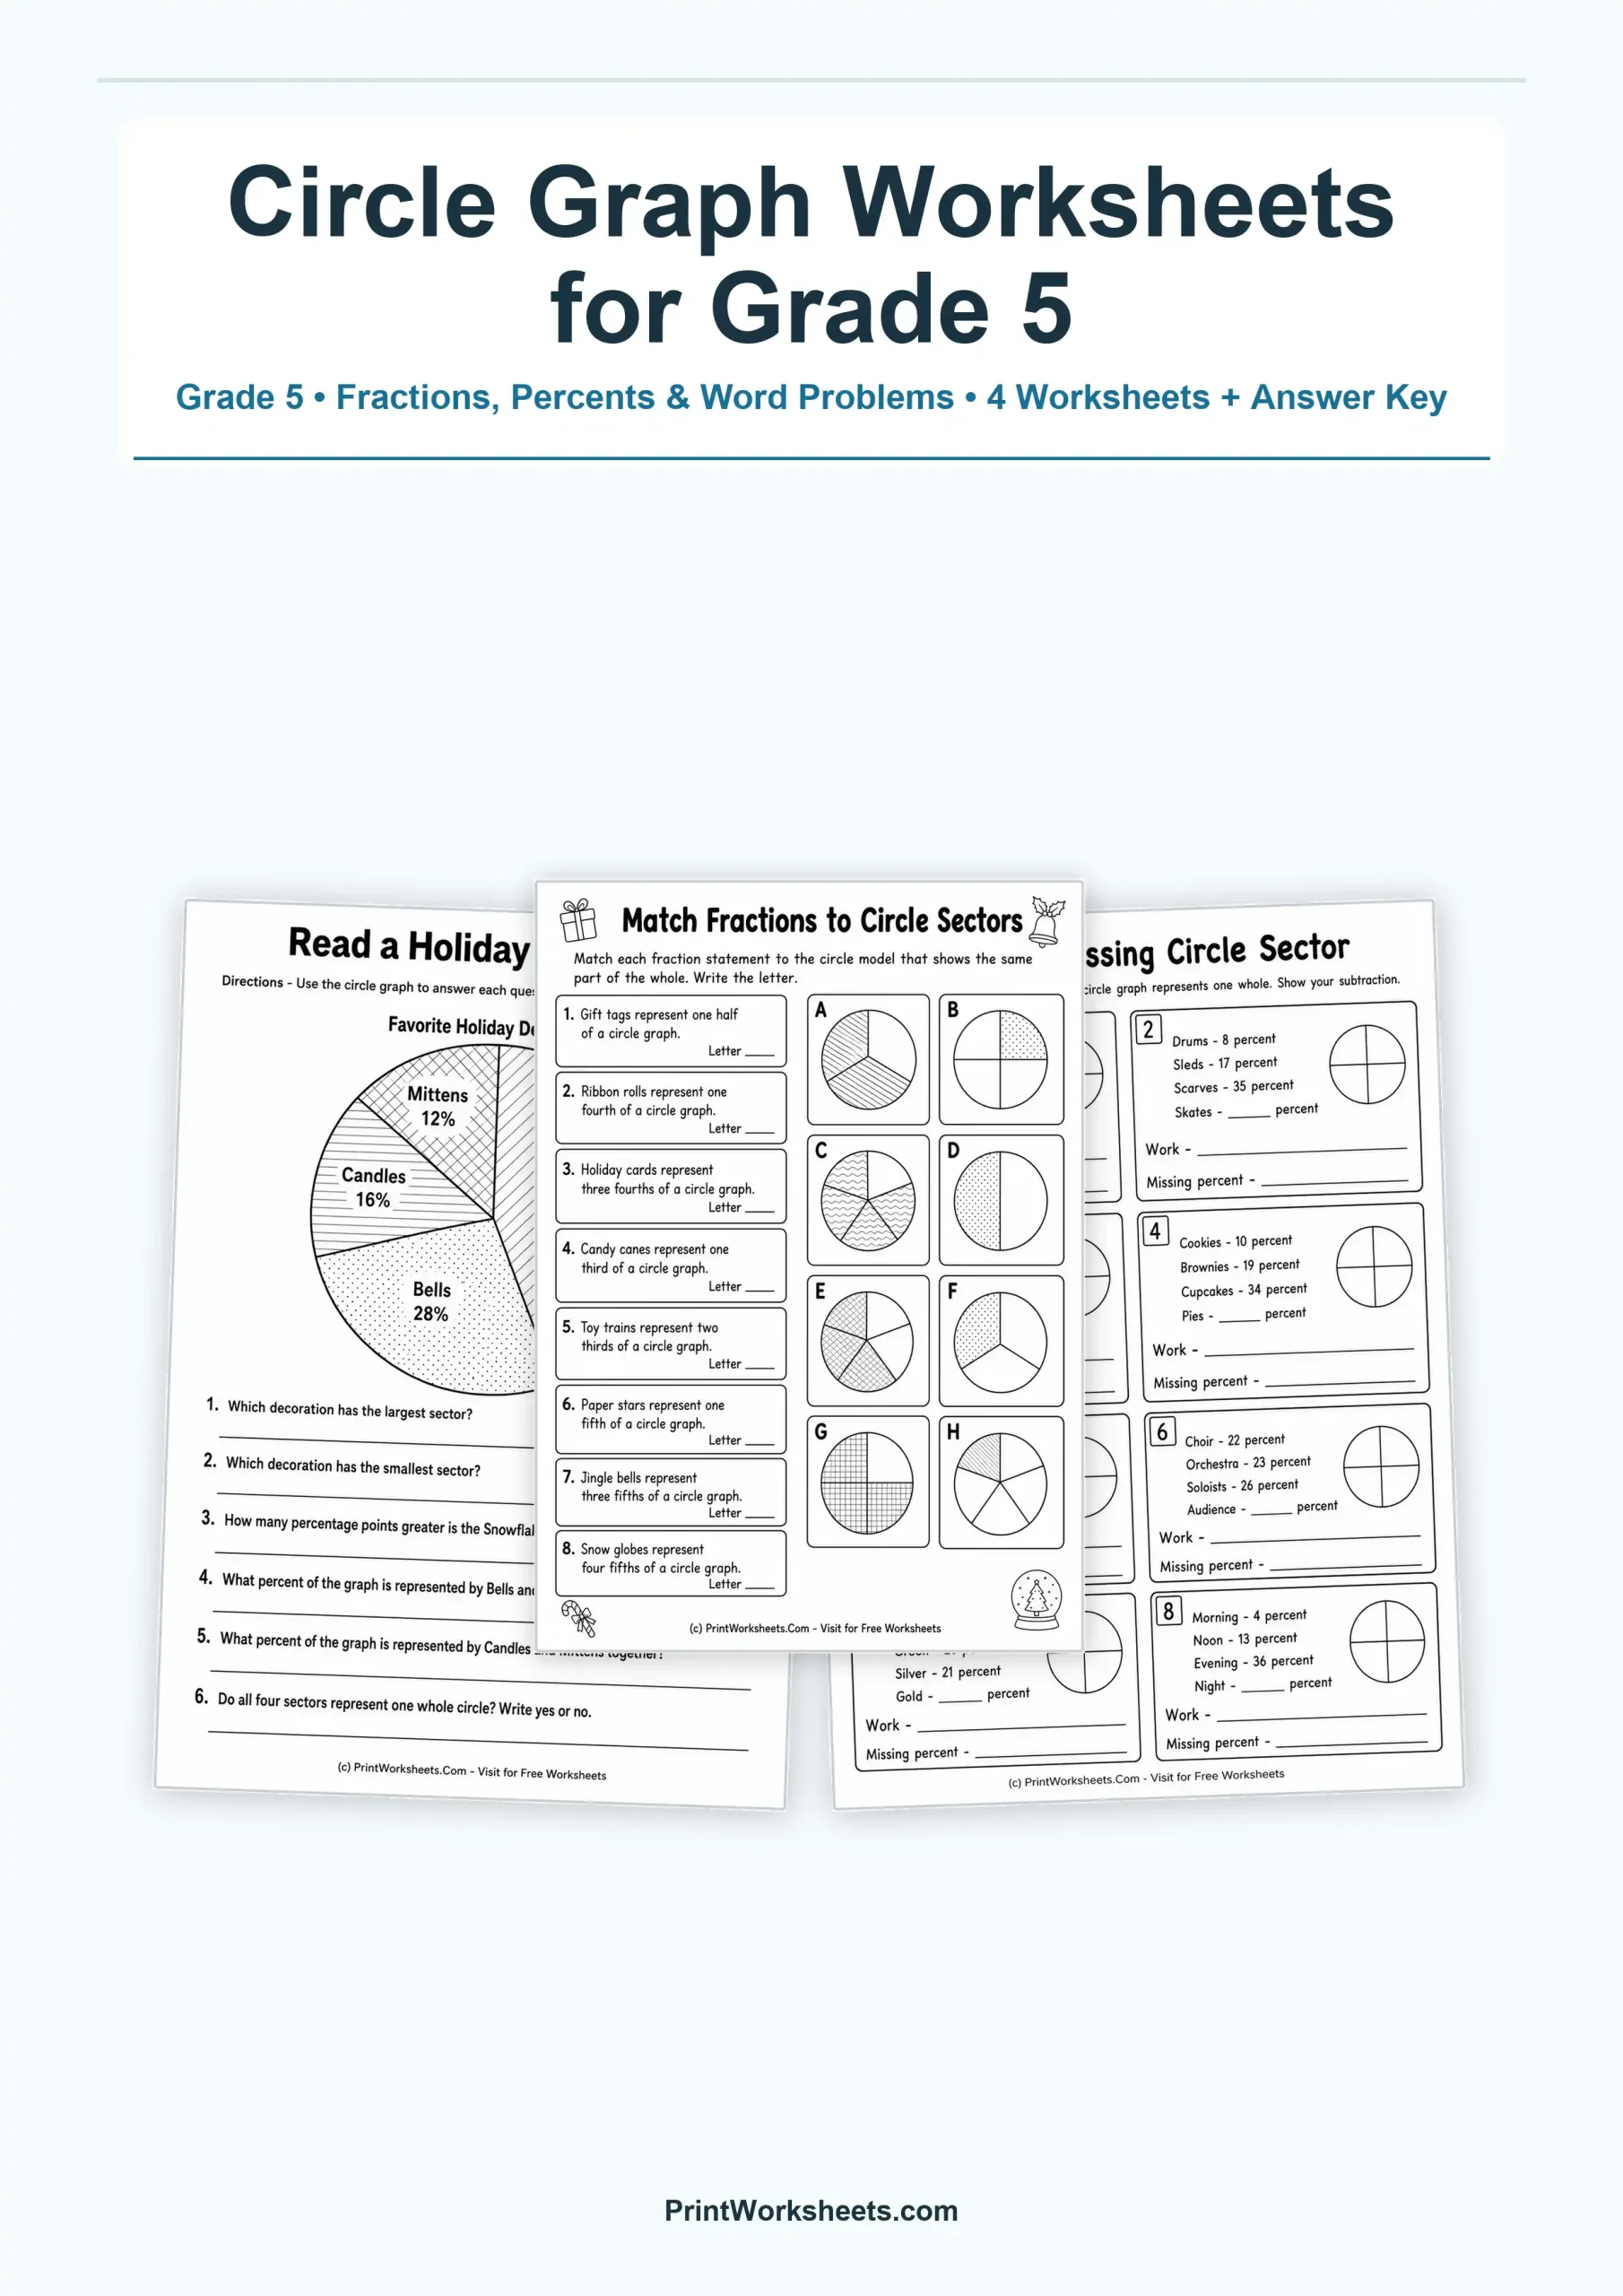
- Pie Chart & Circle Graph Activities: Teach fractions and percentages visually by dividing data into easy-to-understand "slices."
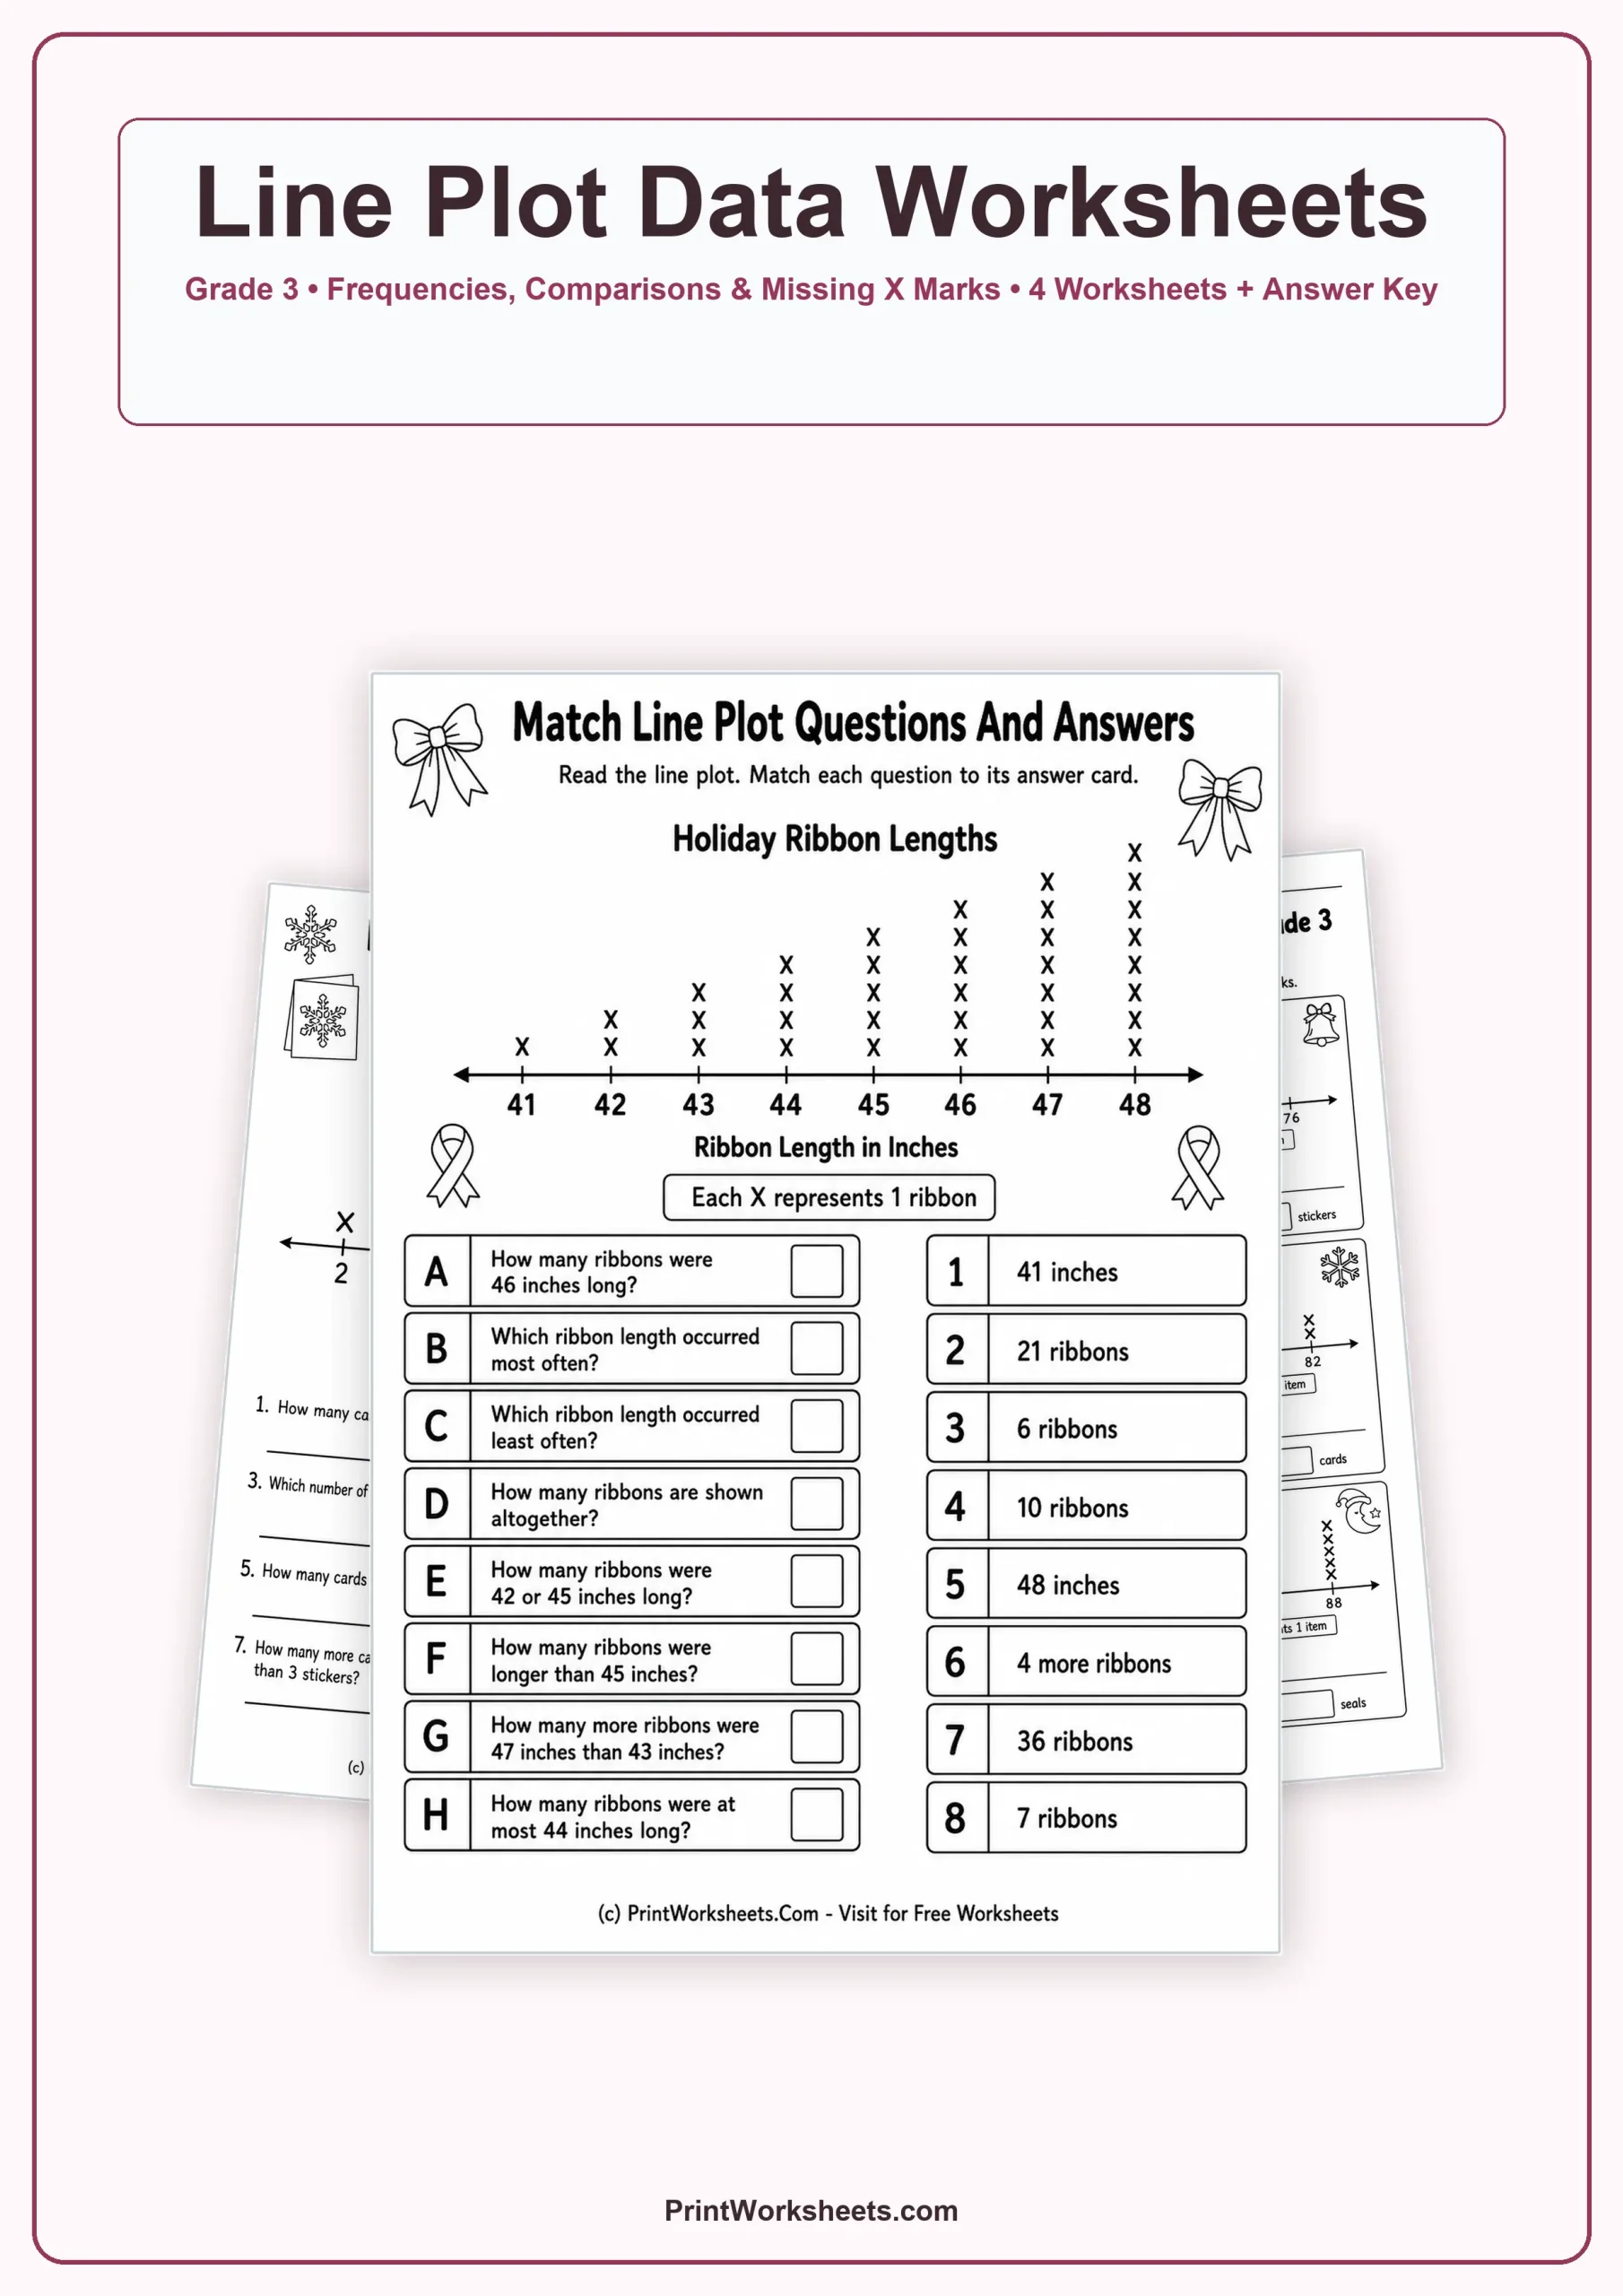
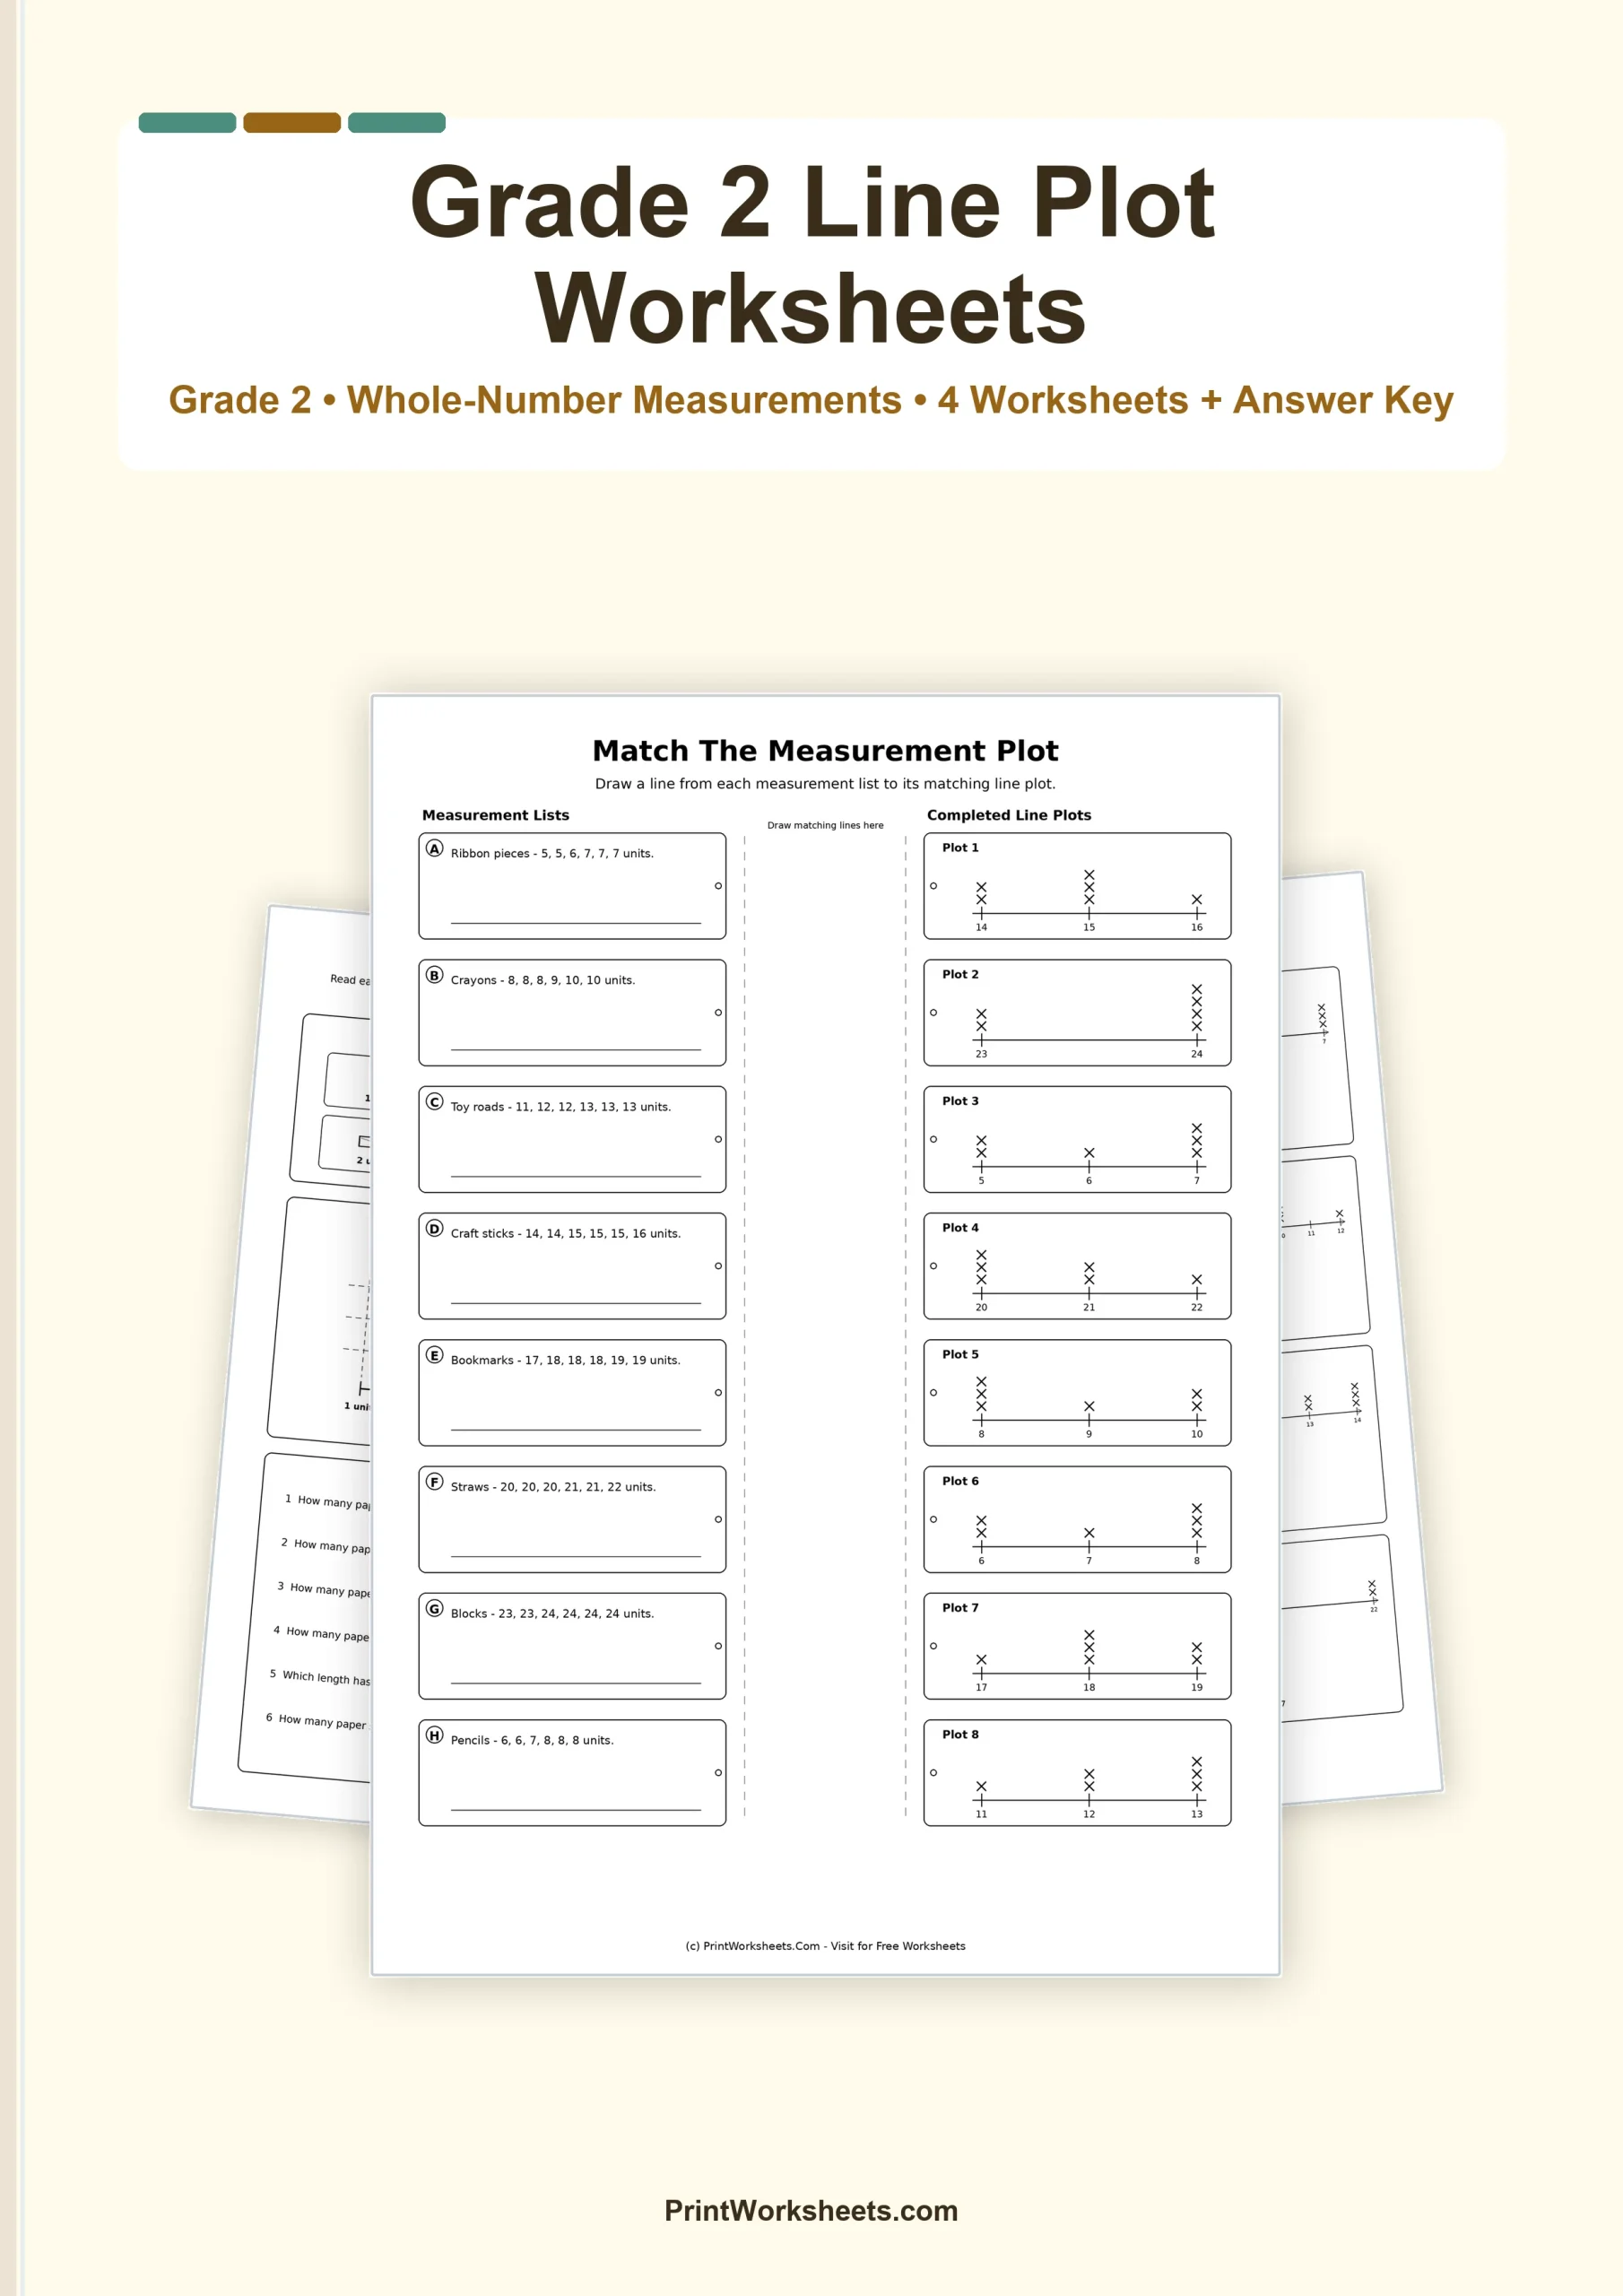
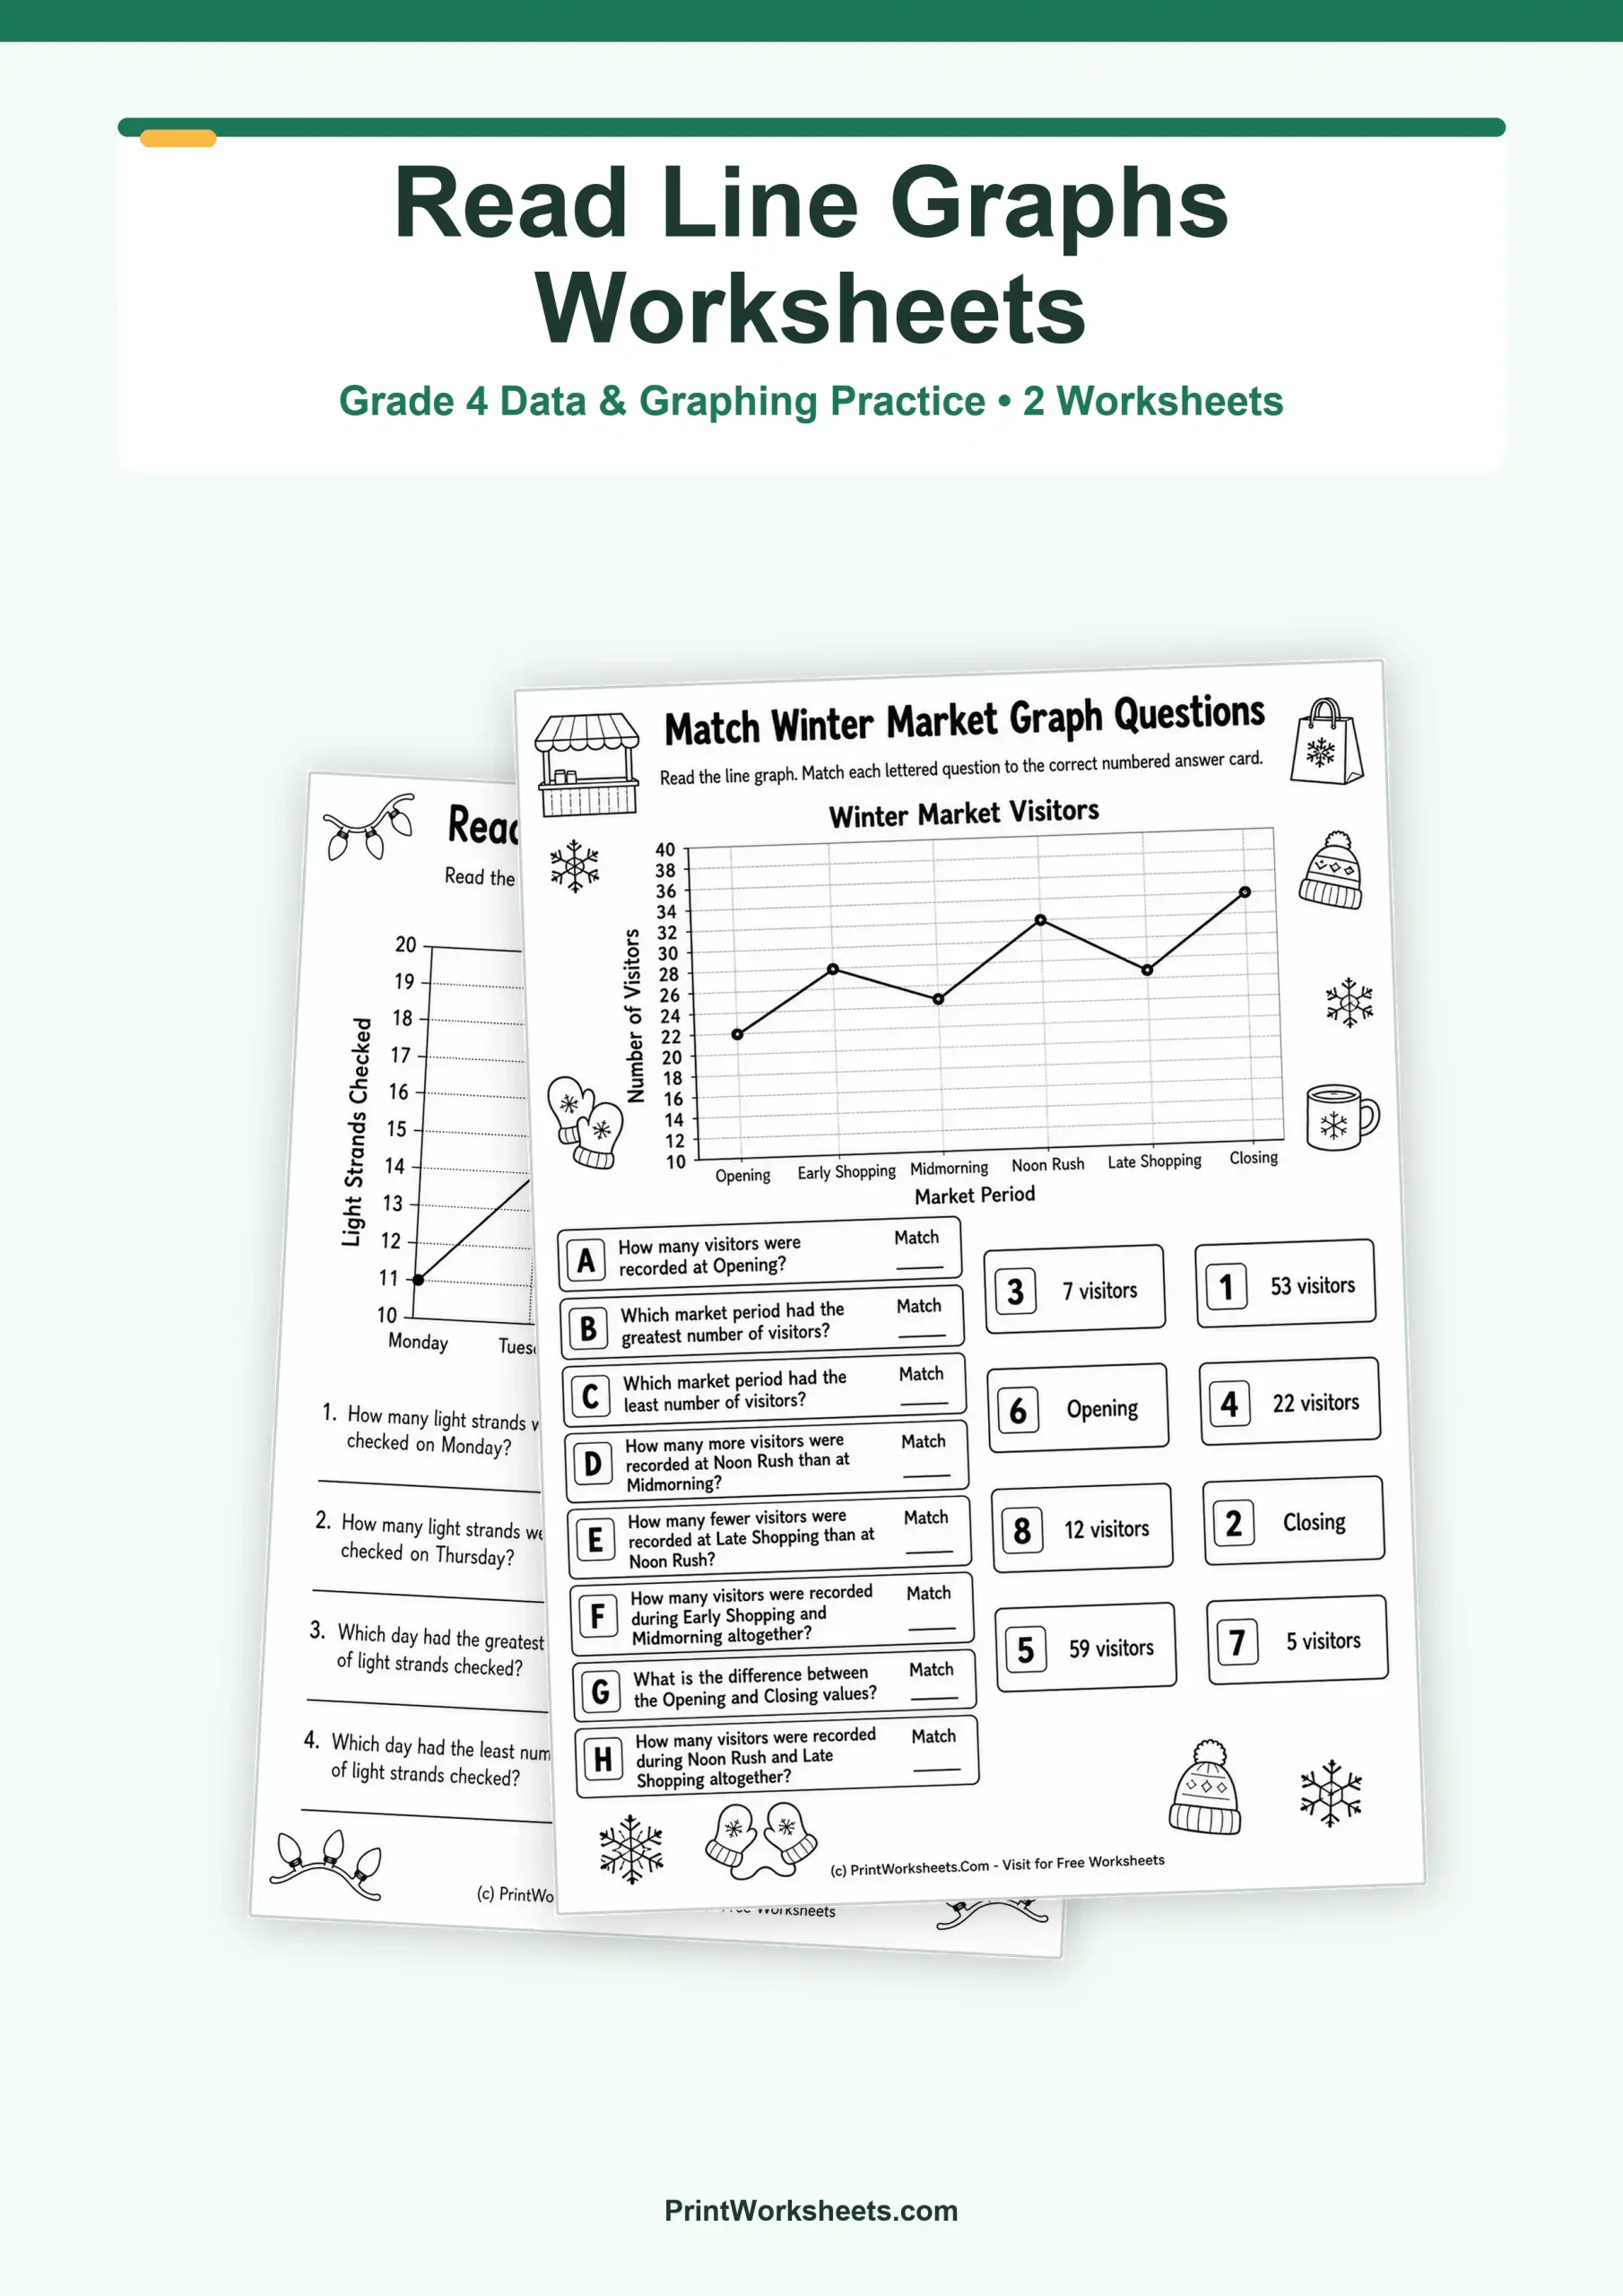
- Line Plot Practice: A crucial skill for upper elementary grades, our line plot worksheets help students display frequency of data along a number line.
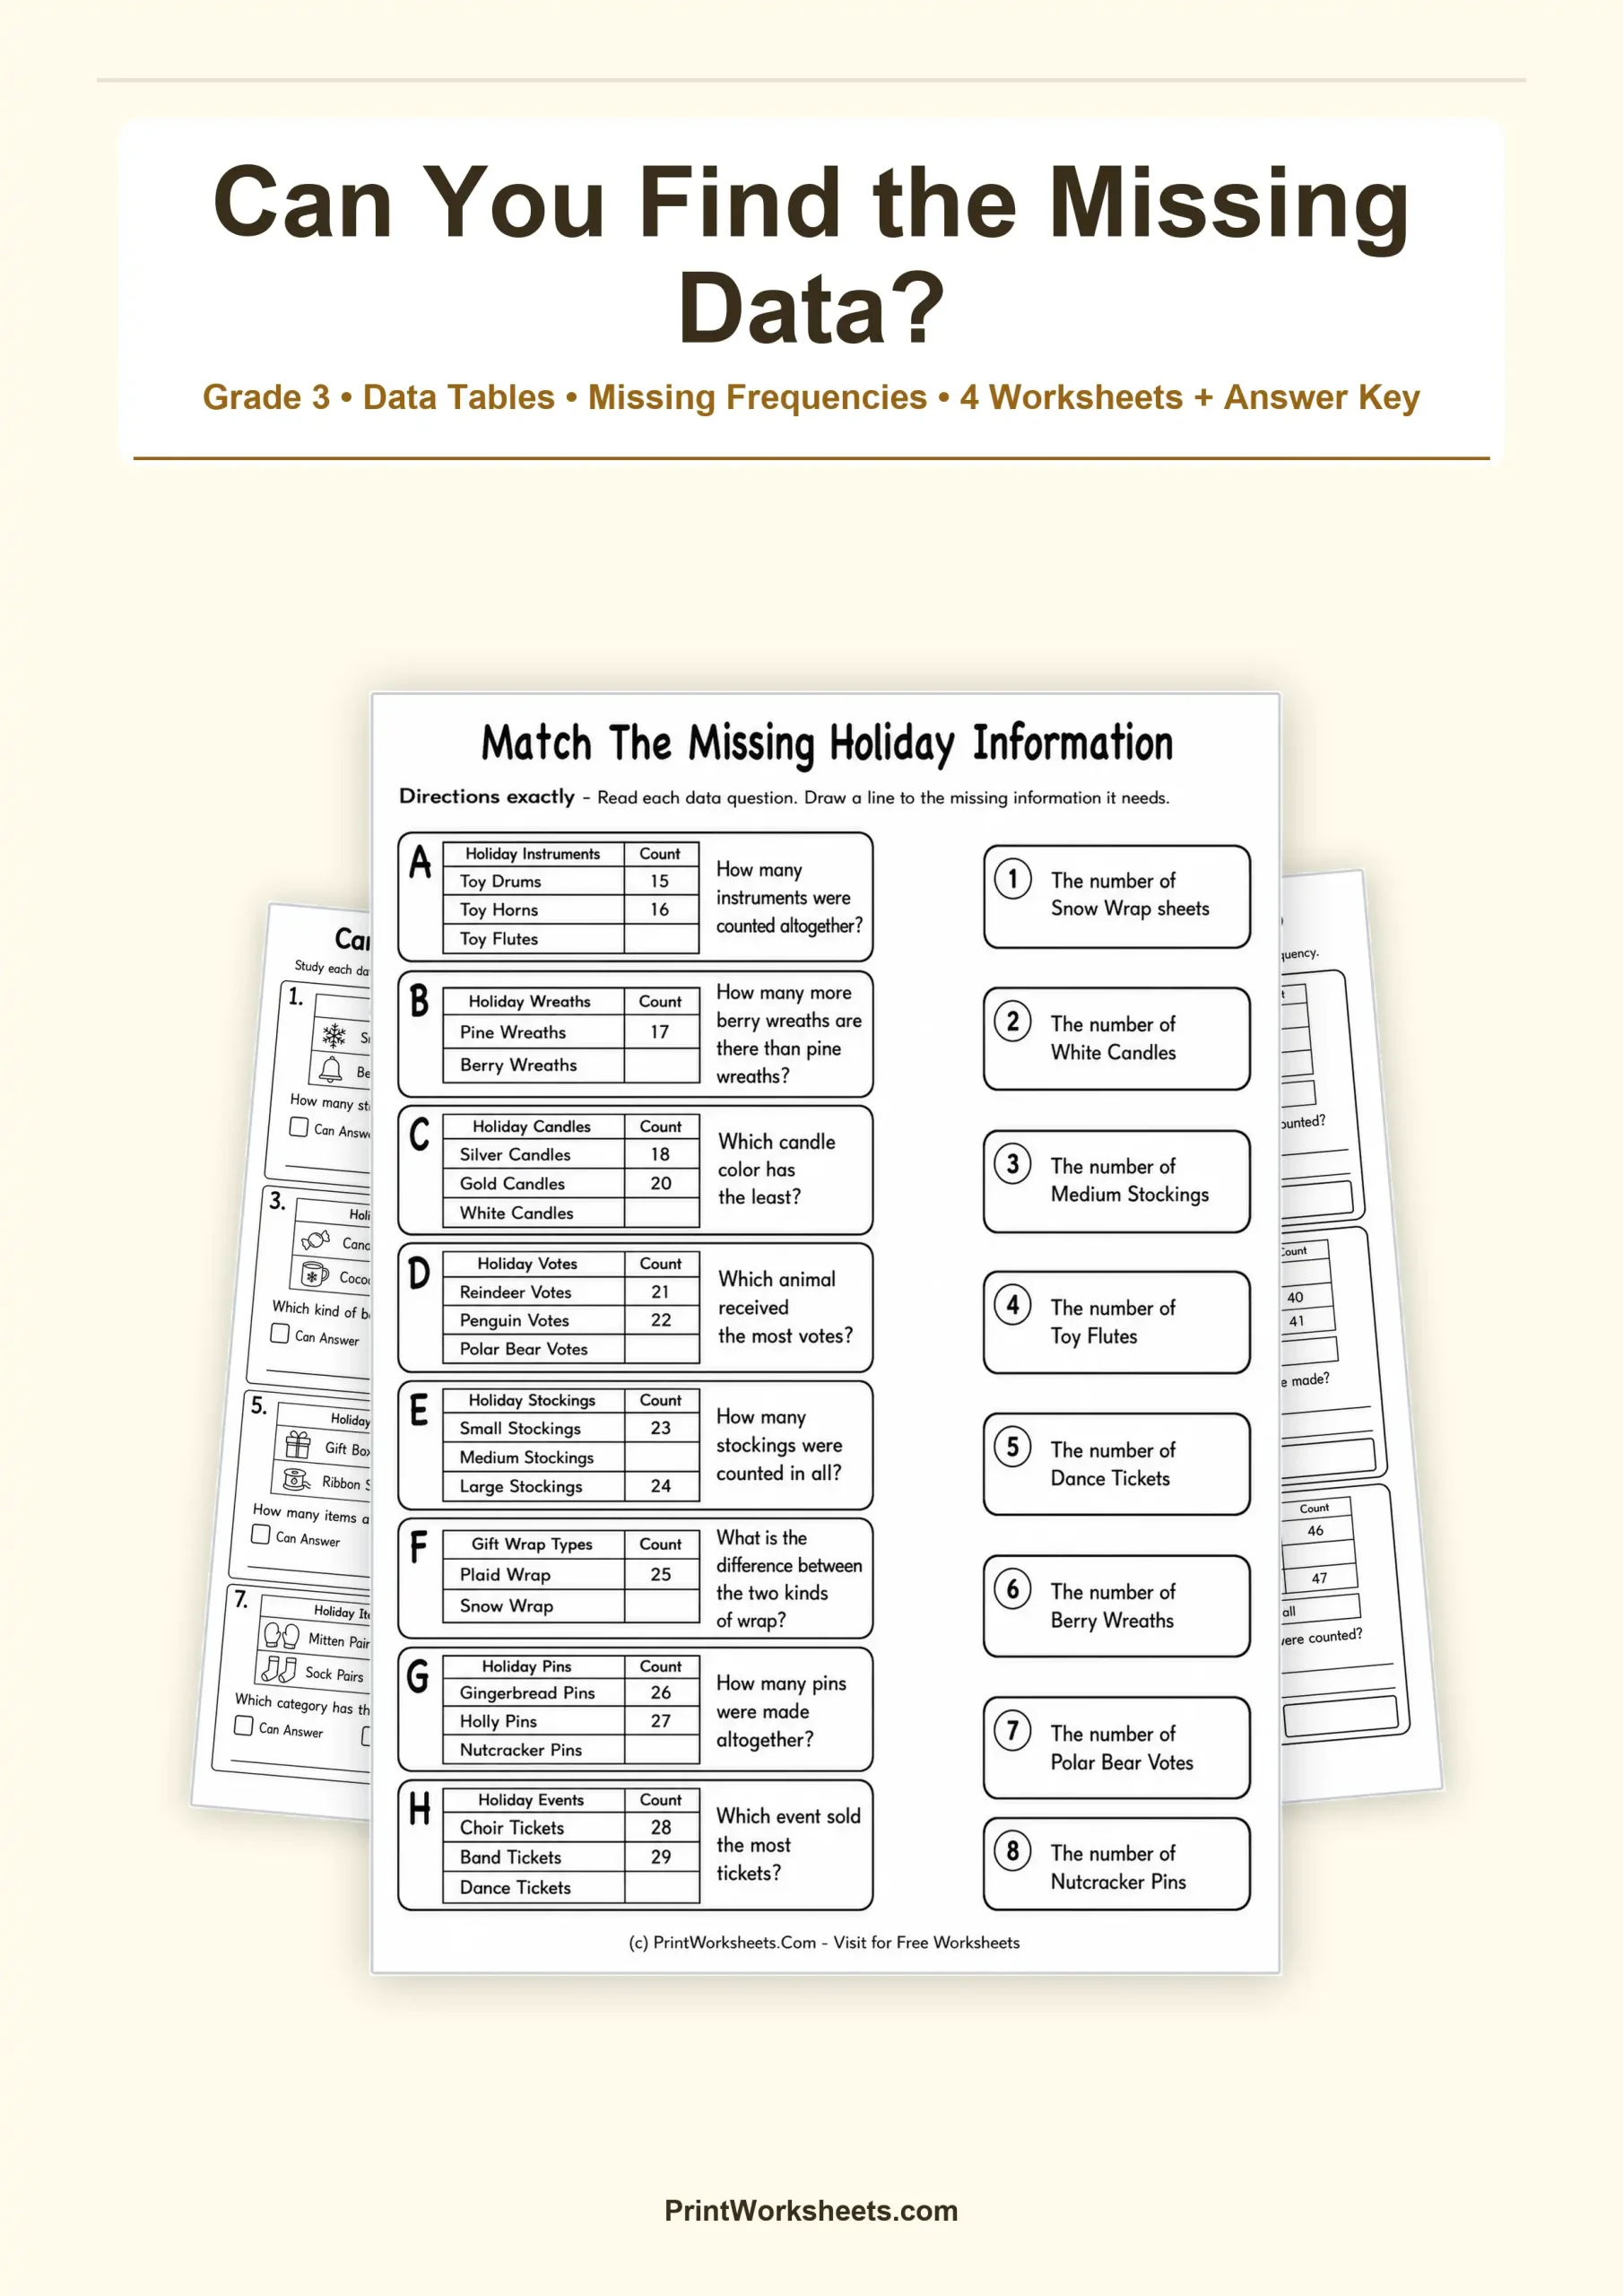
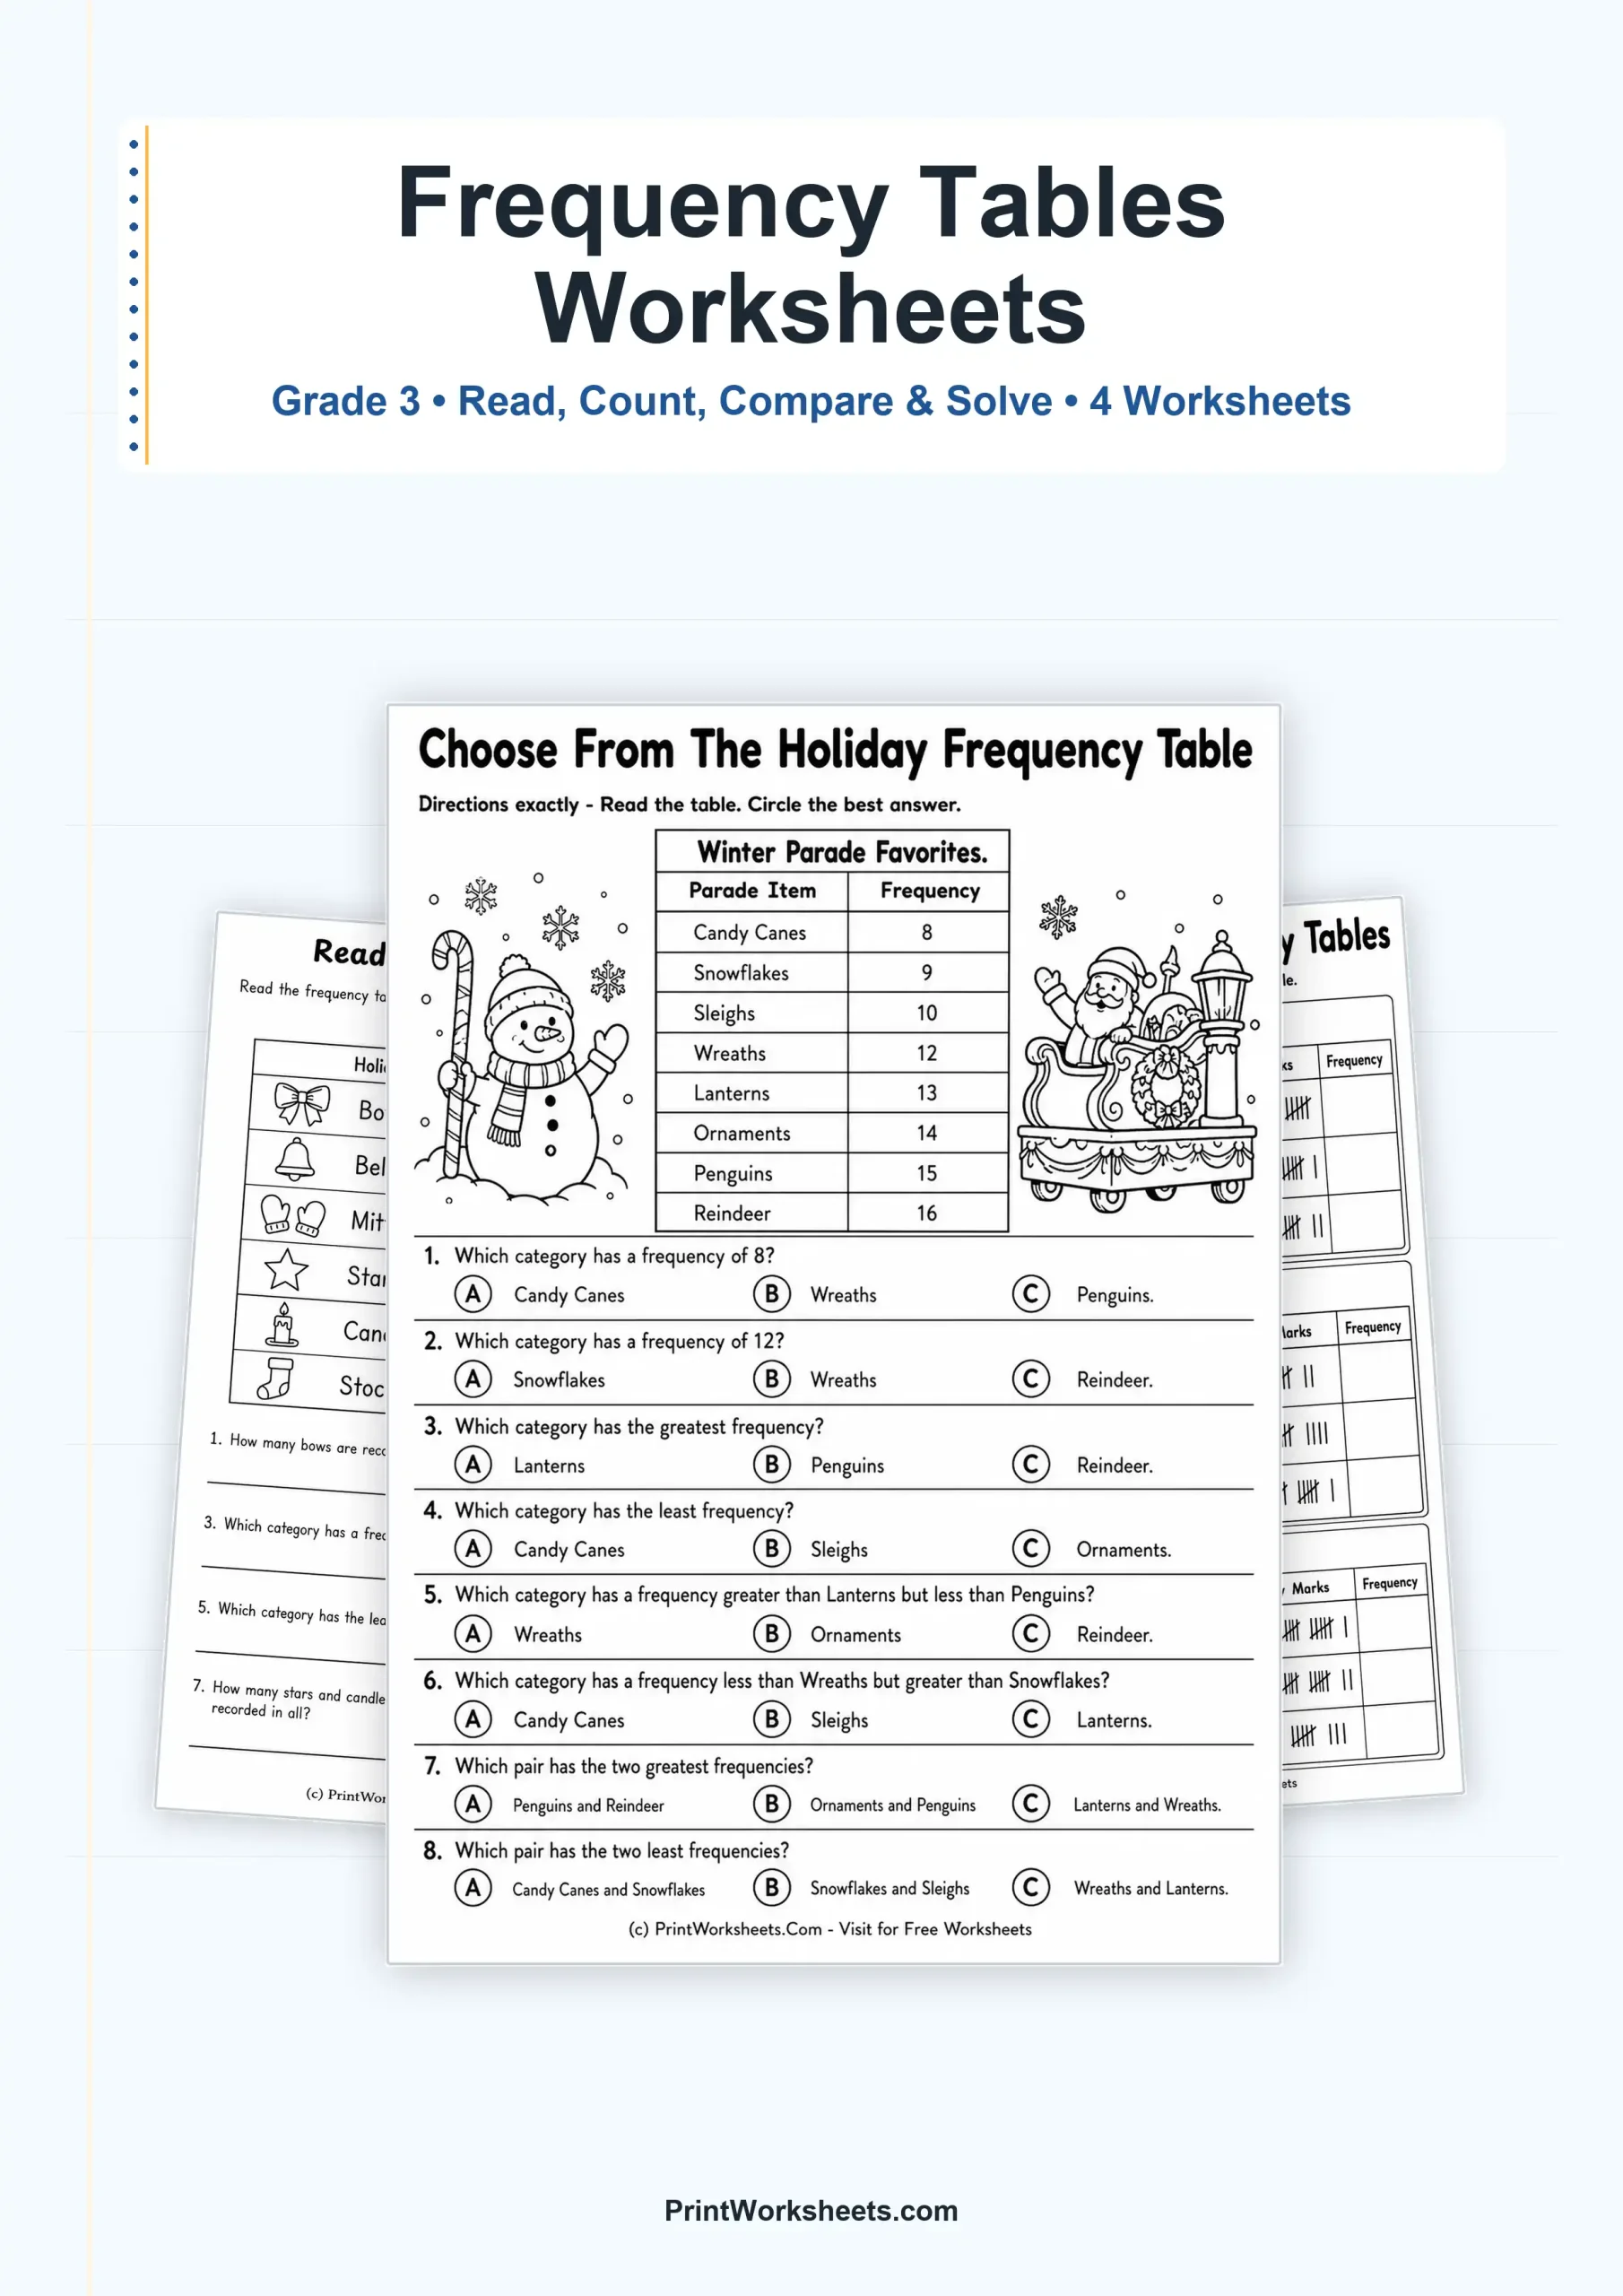
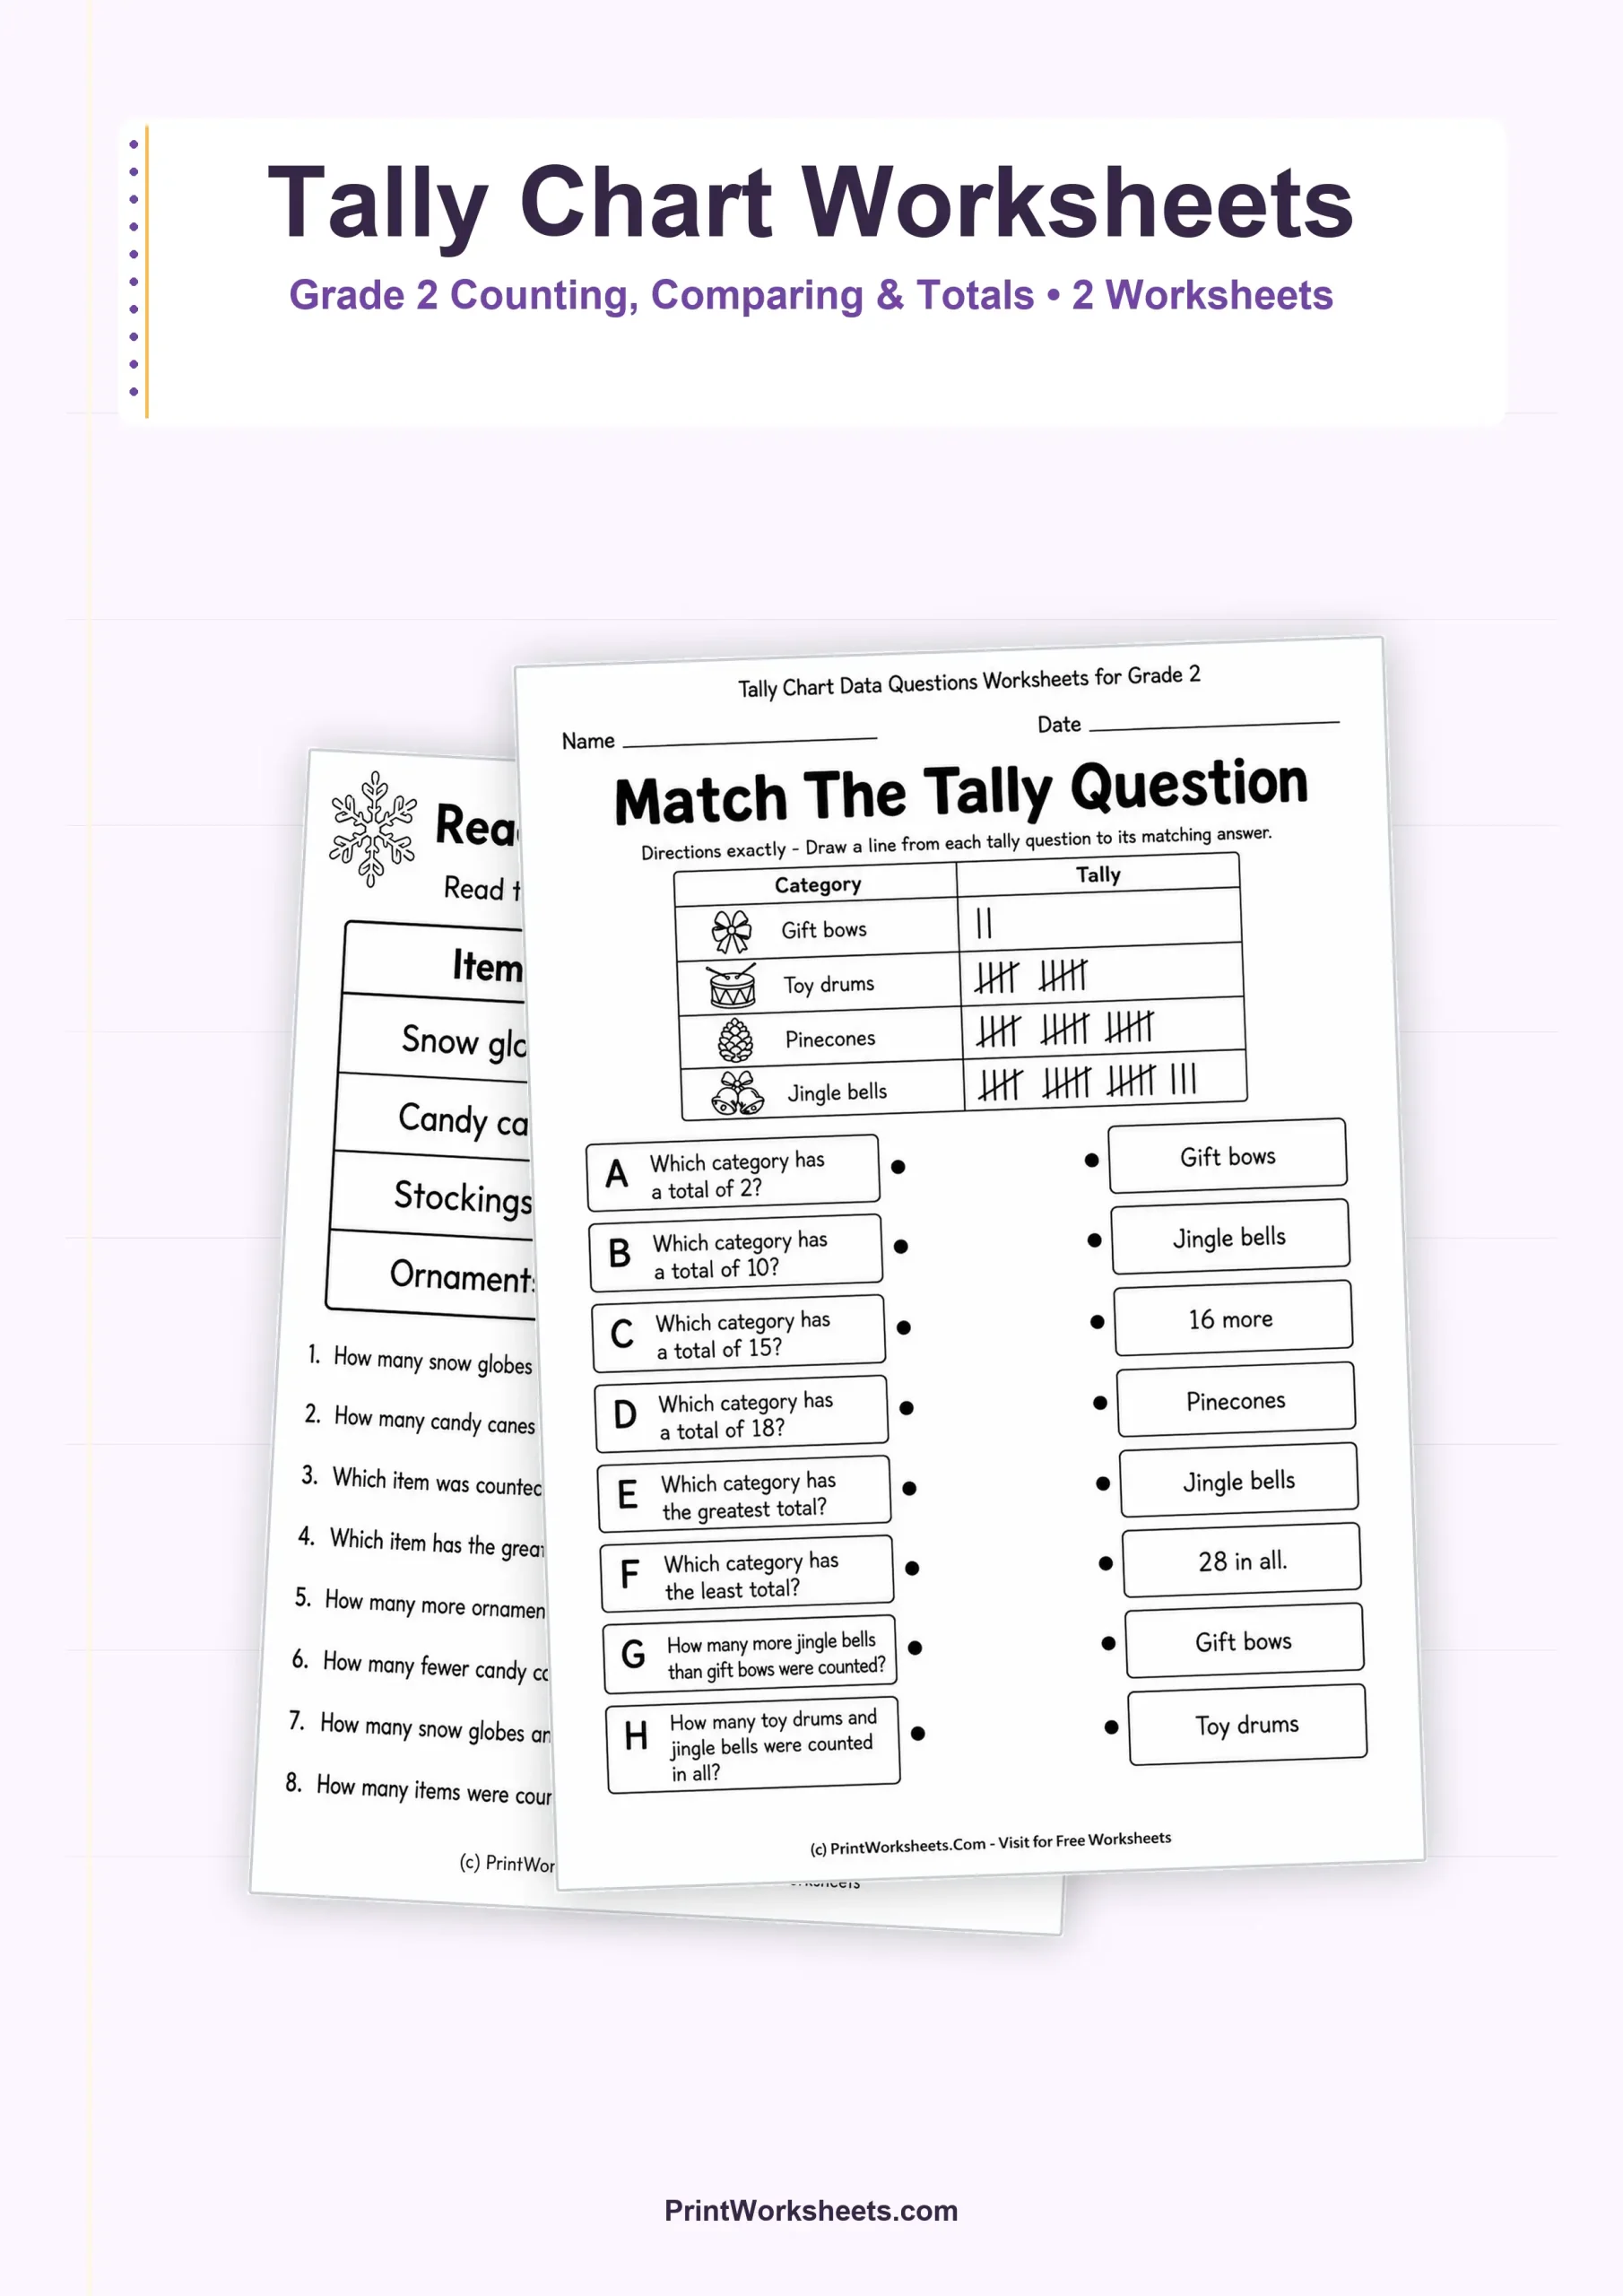
- Tally Marks and Frequency Tables: Before graphing, students must learn to collect data! These sheets focus on counting, grouping, and recording numbers using tallies.
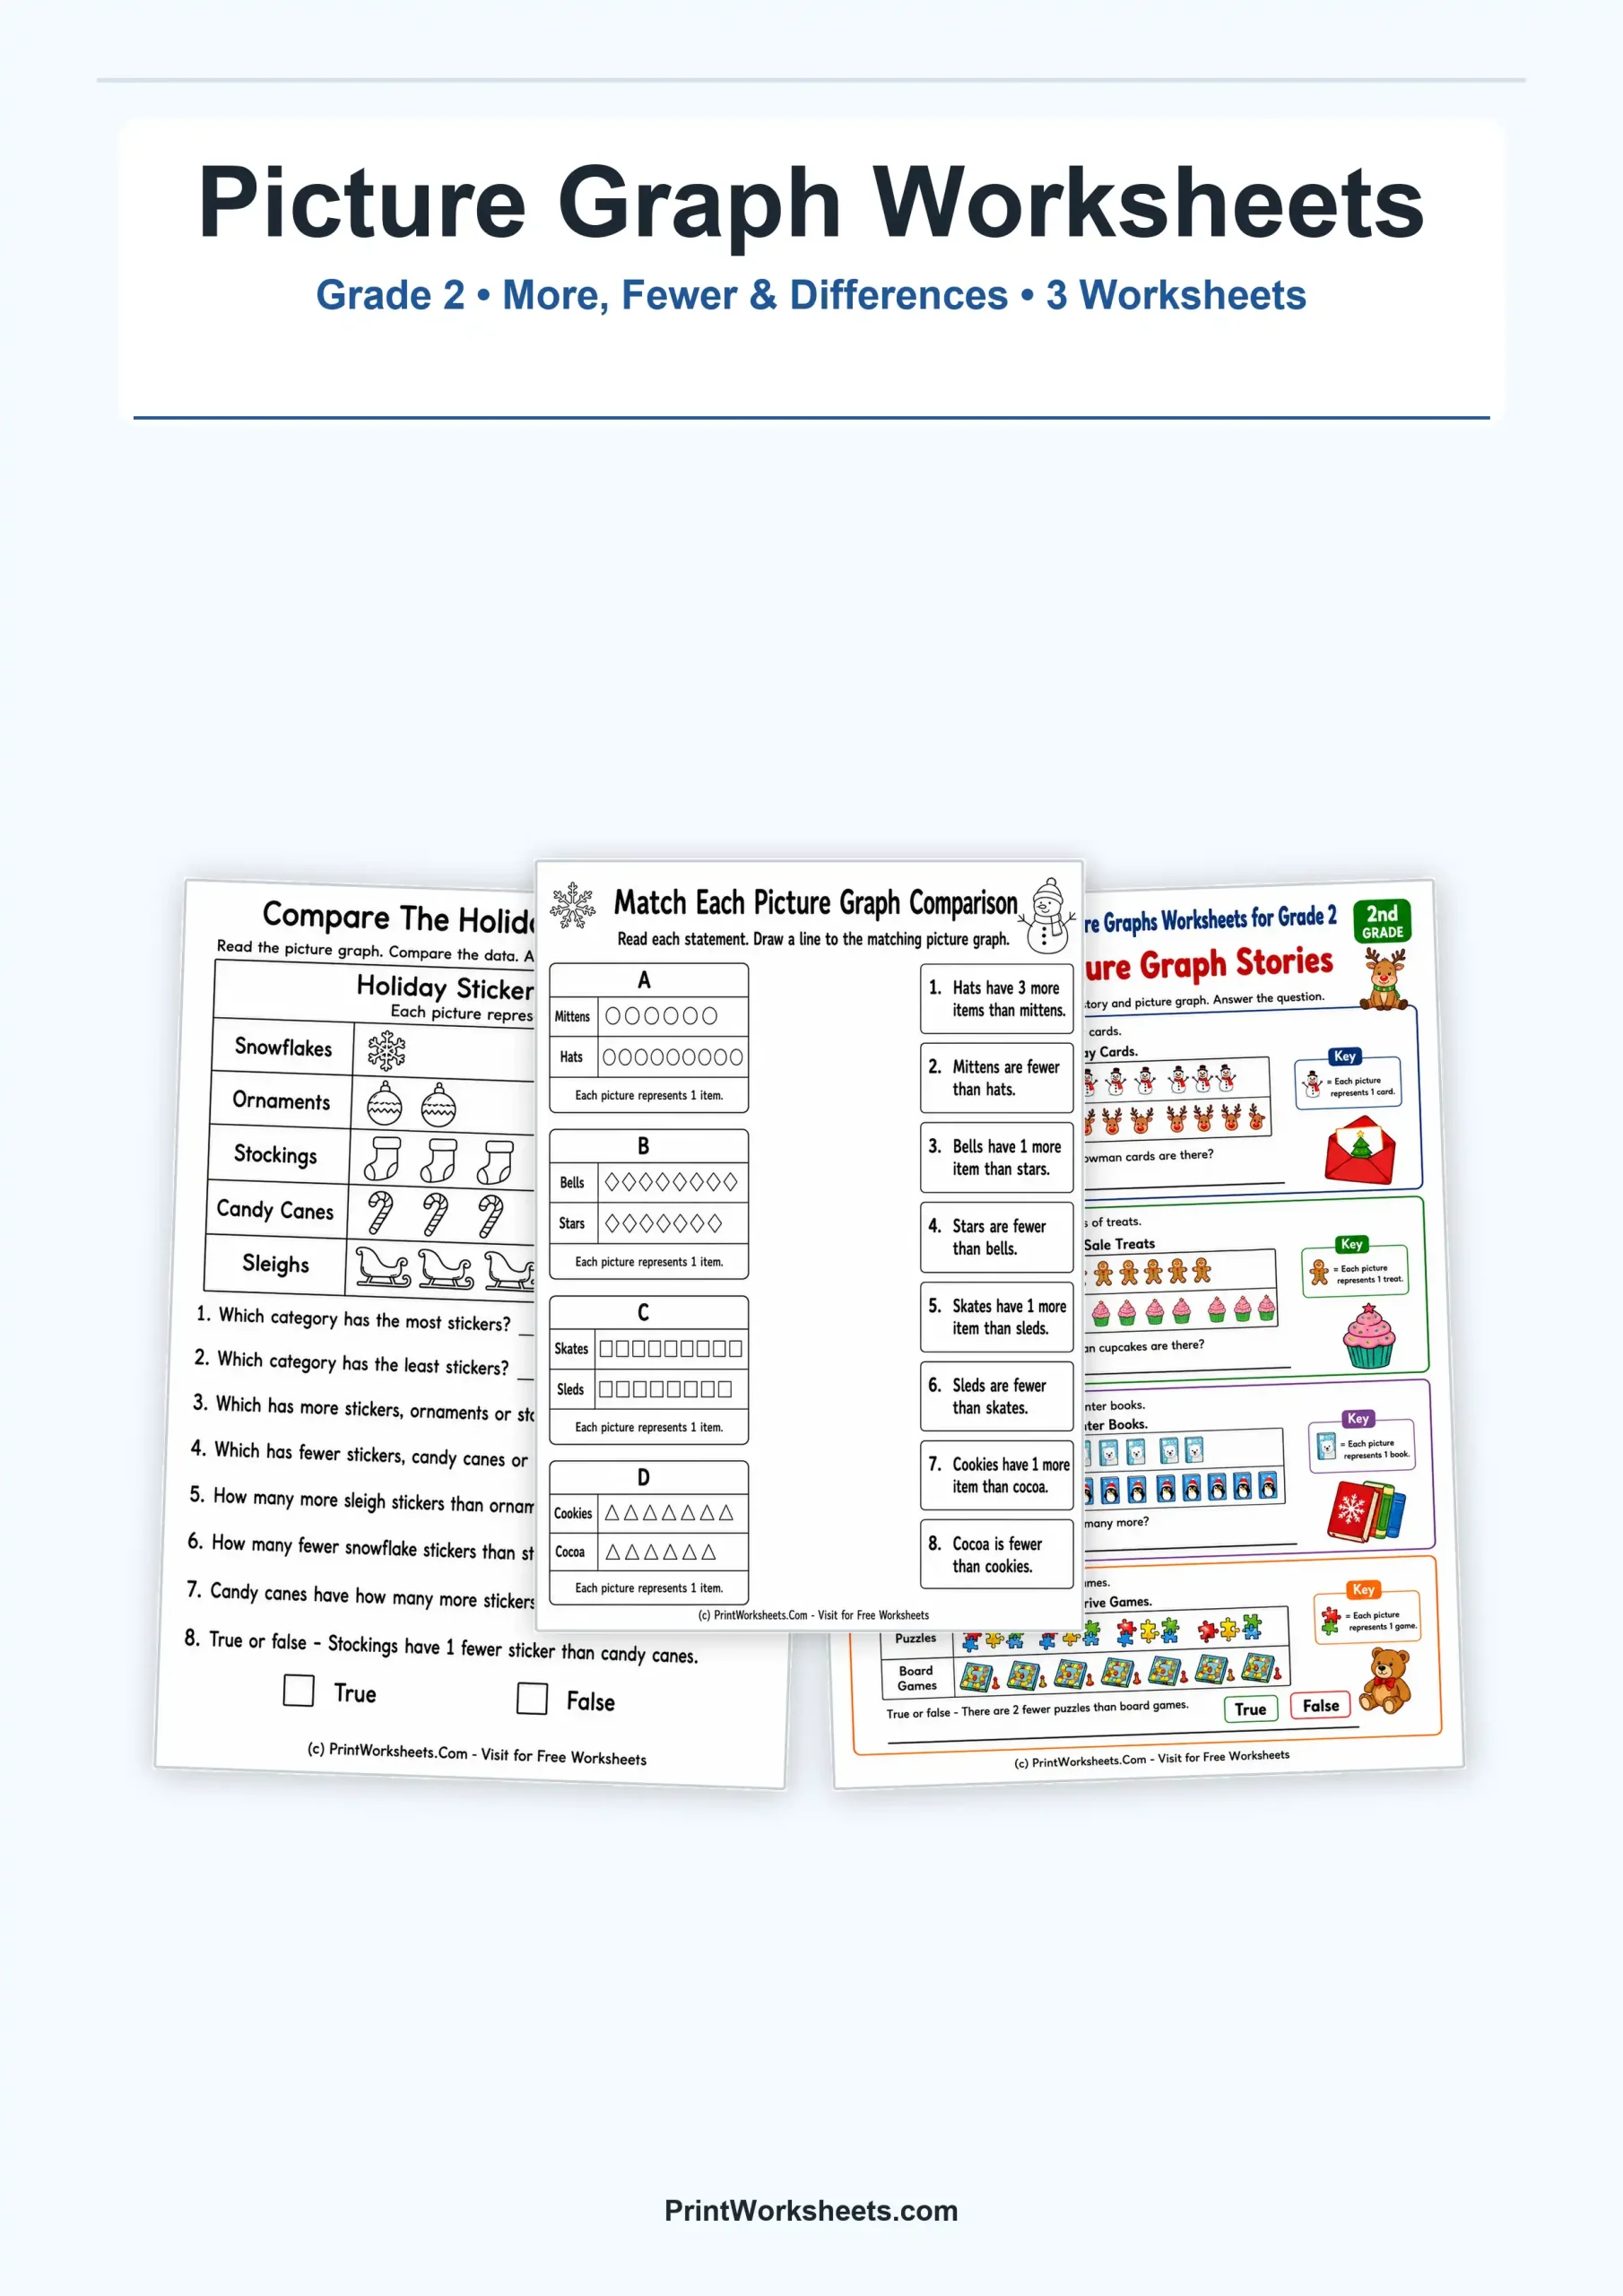
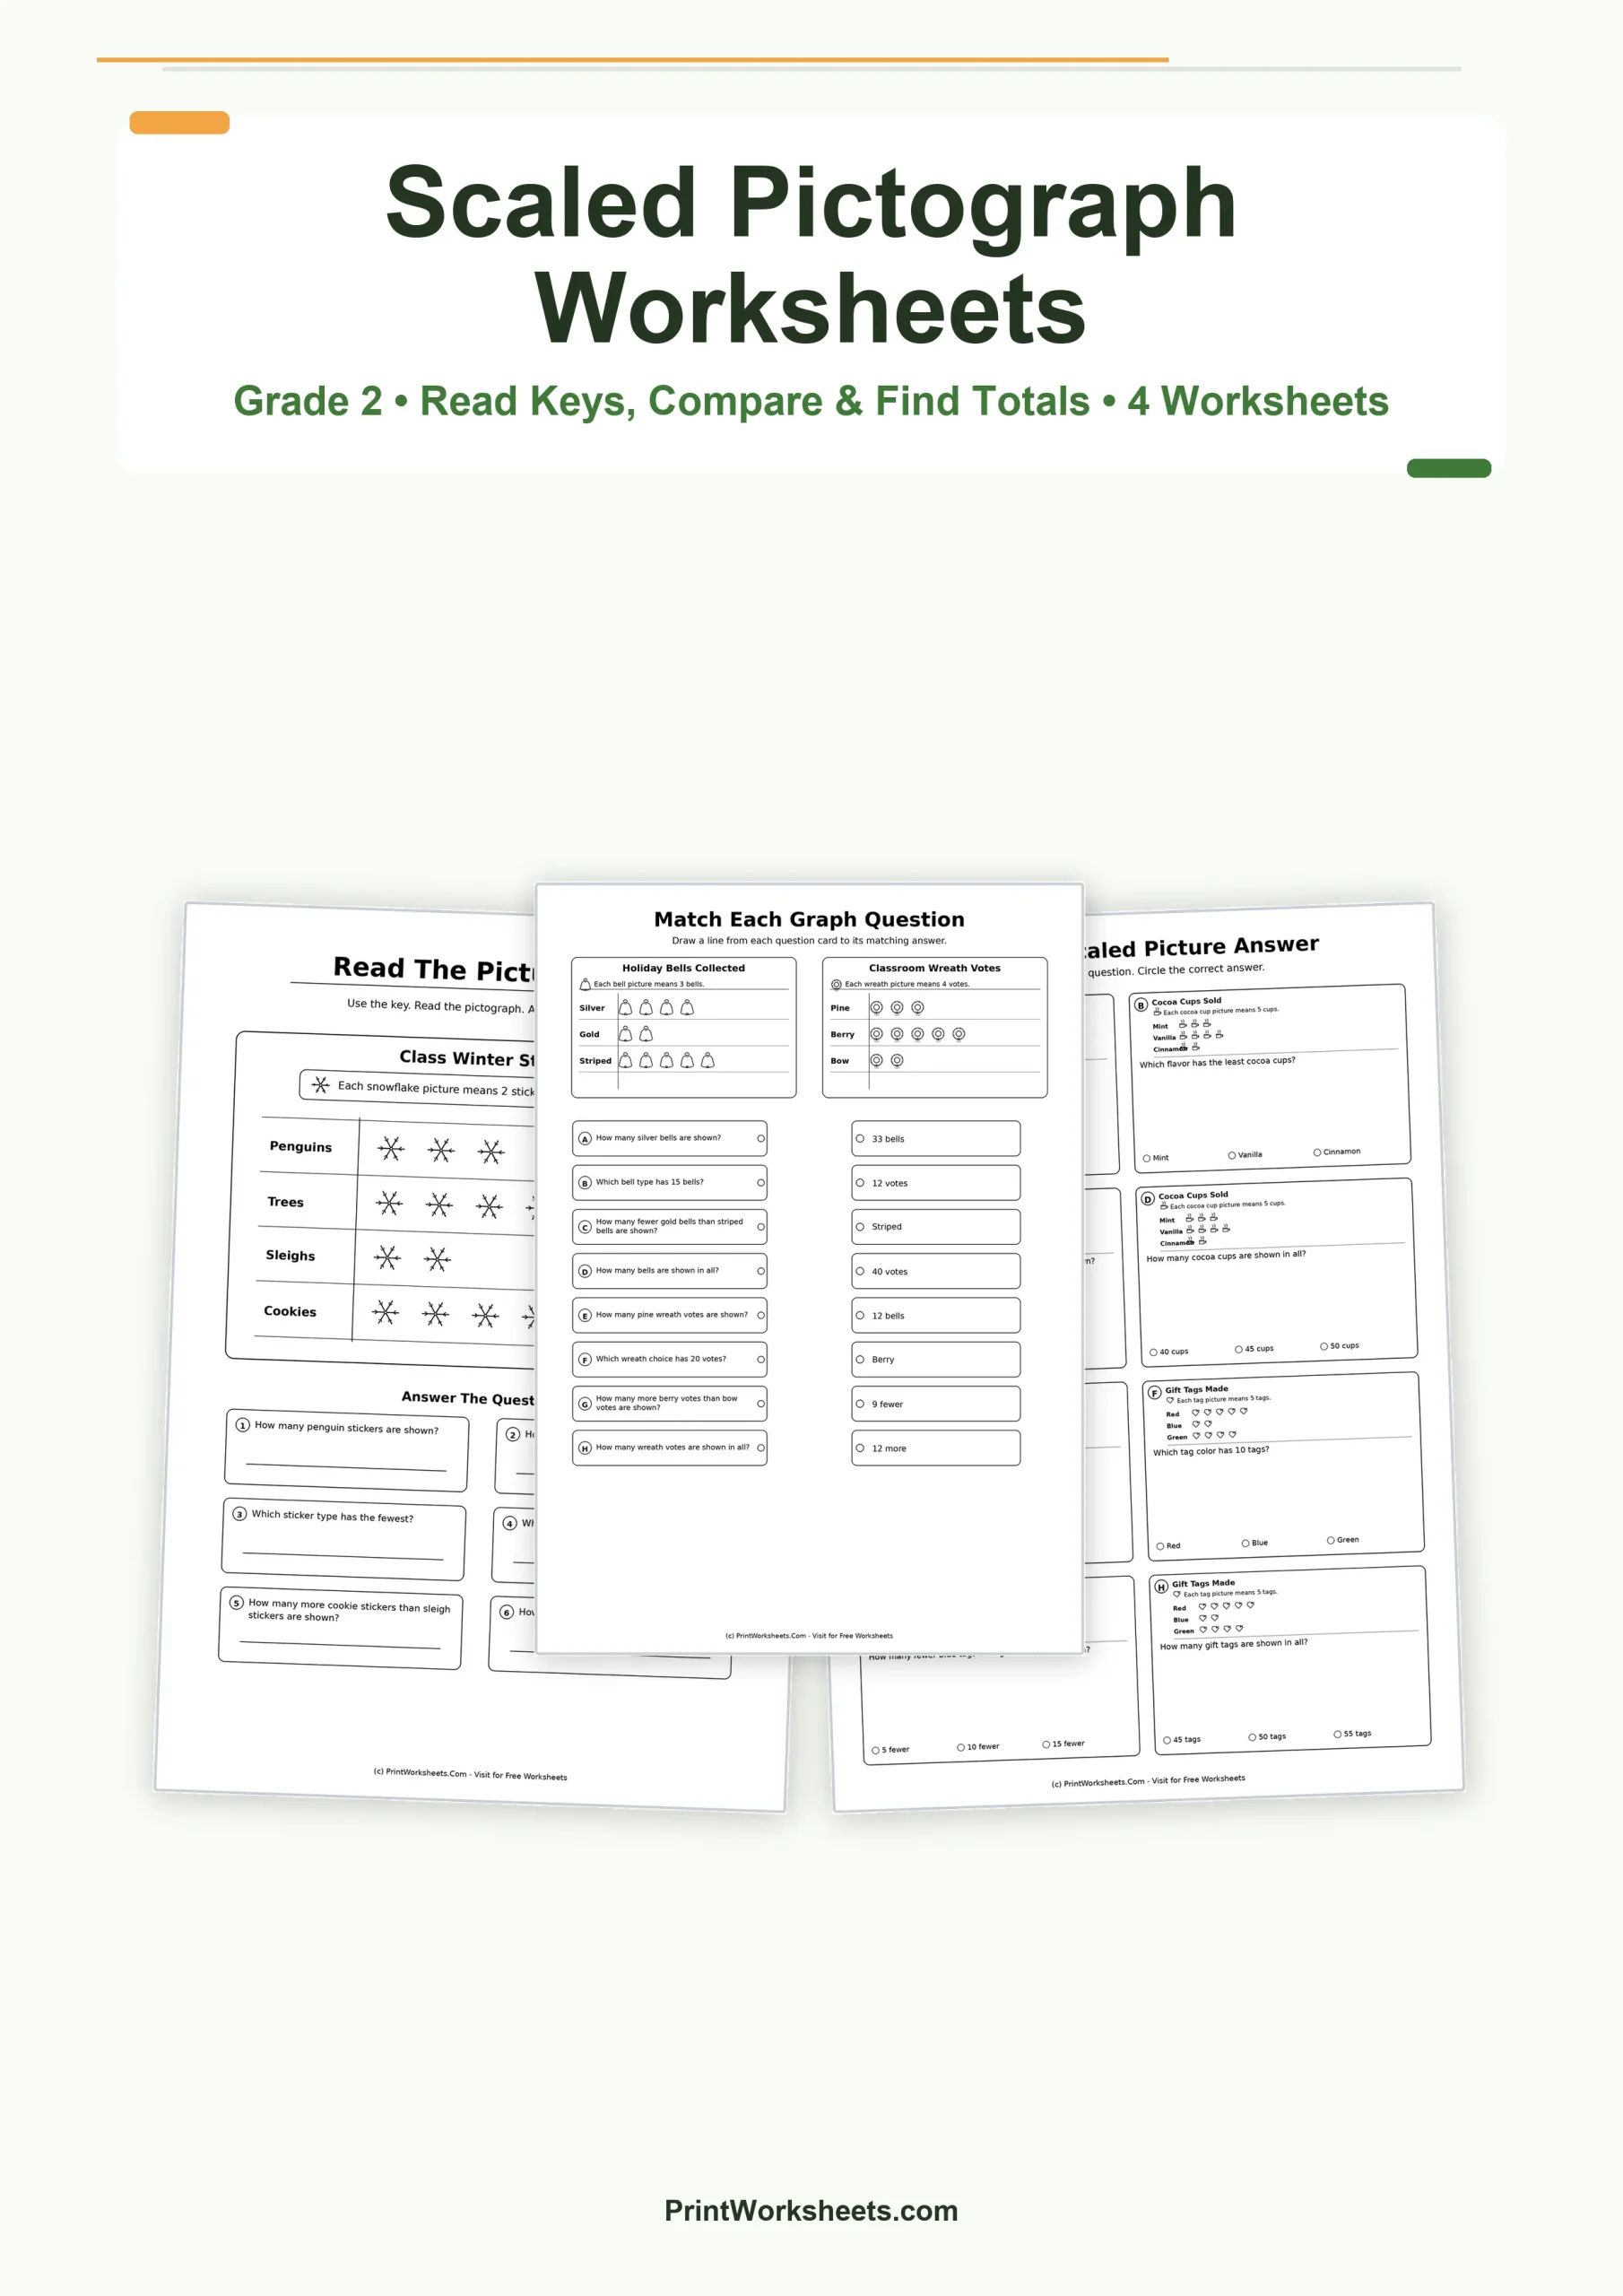
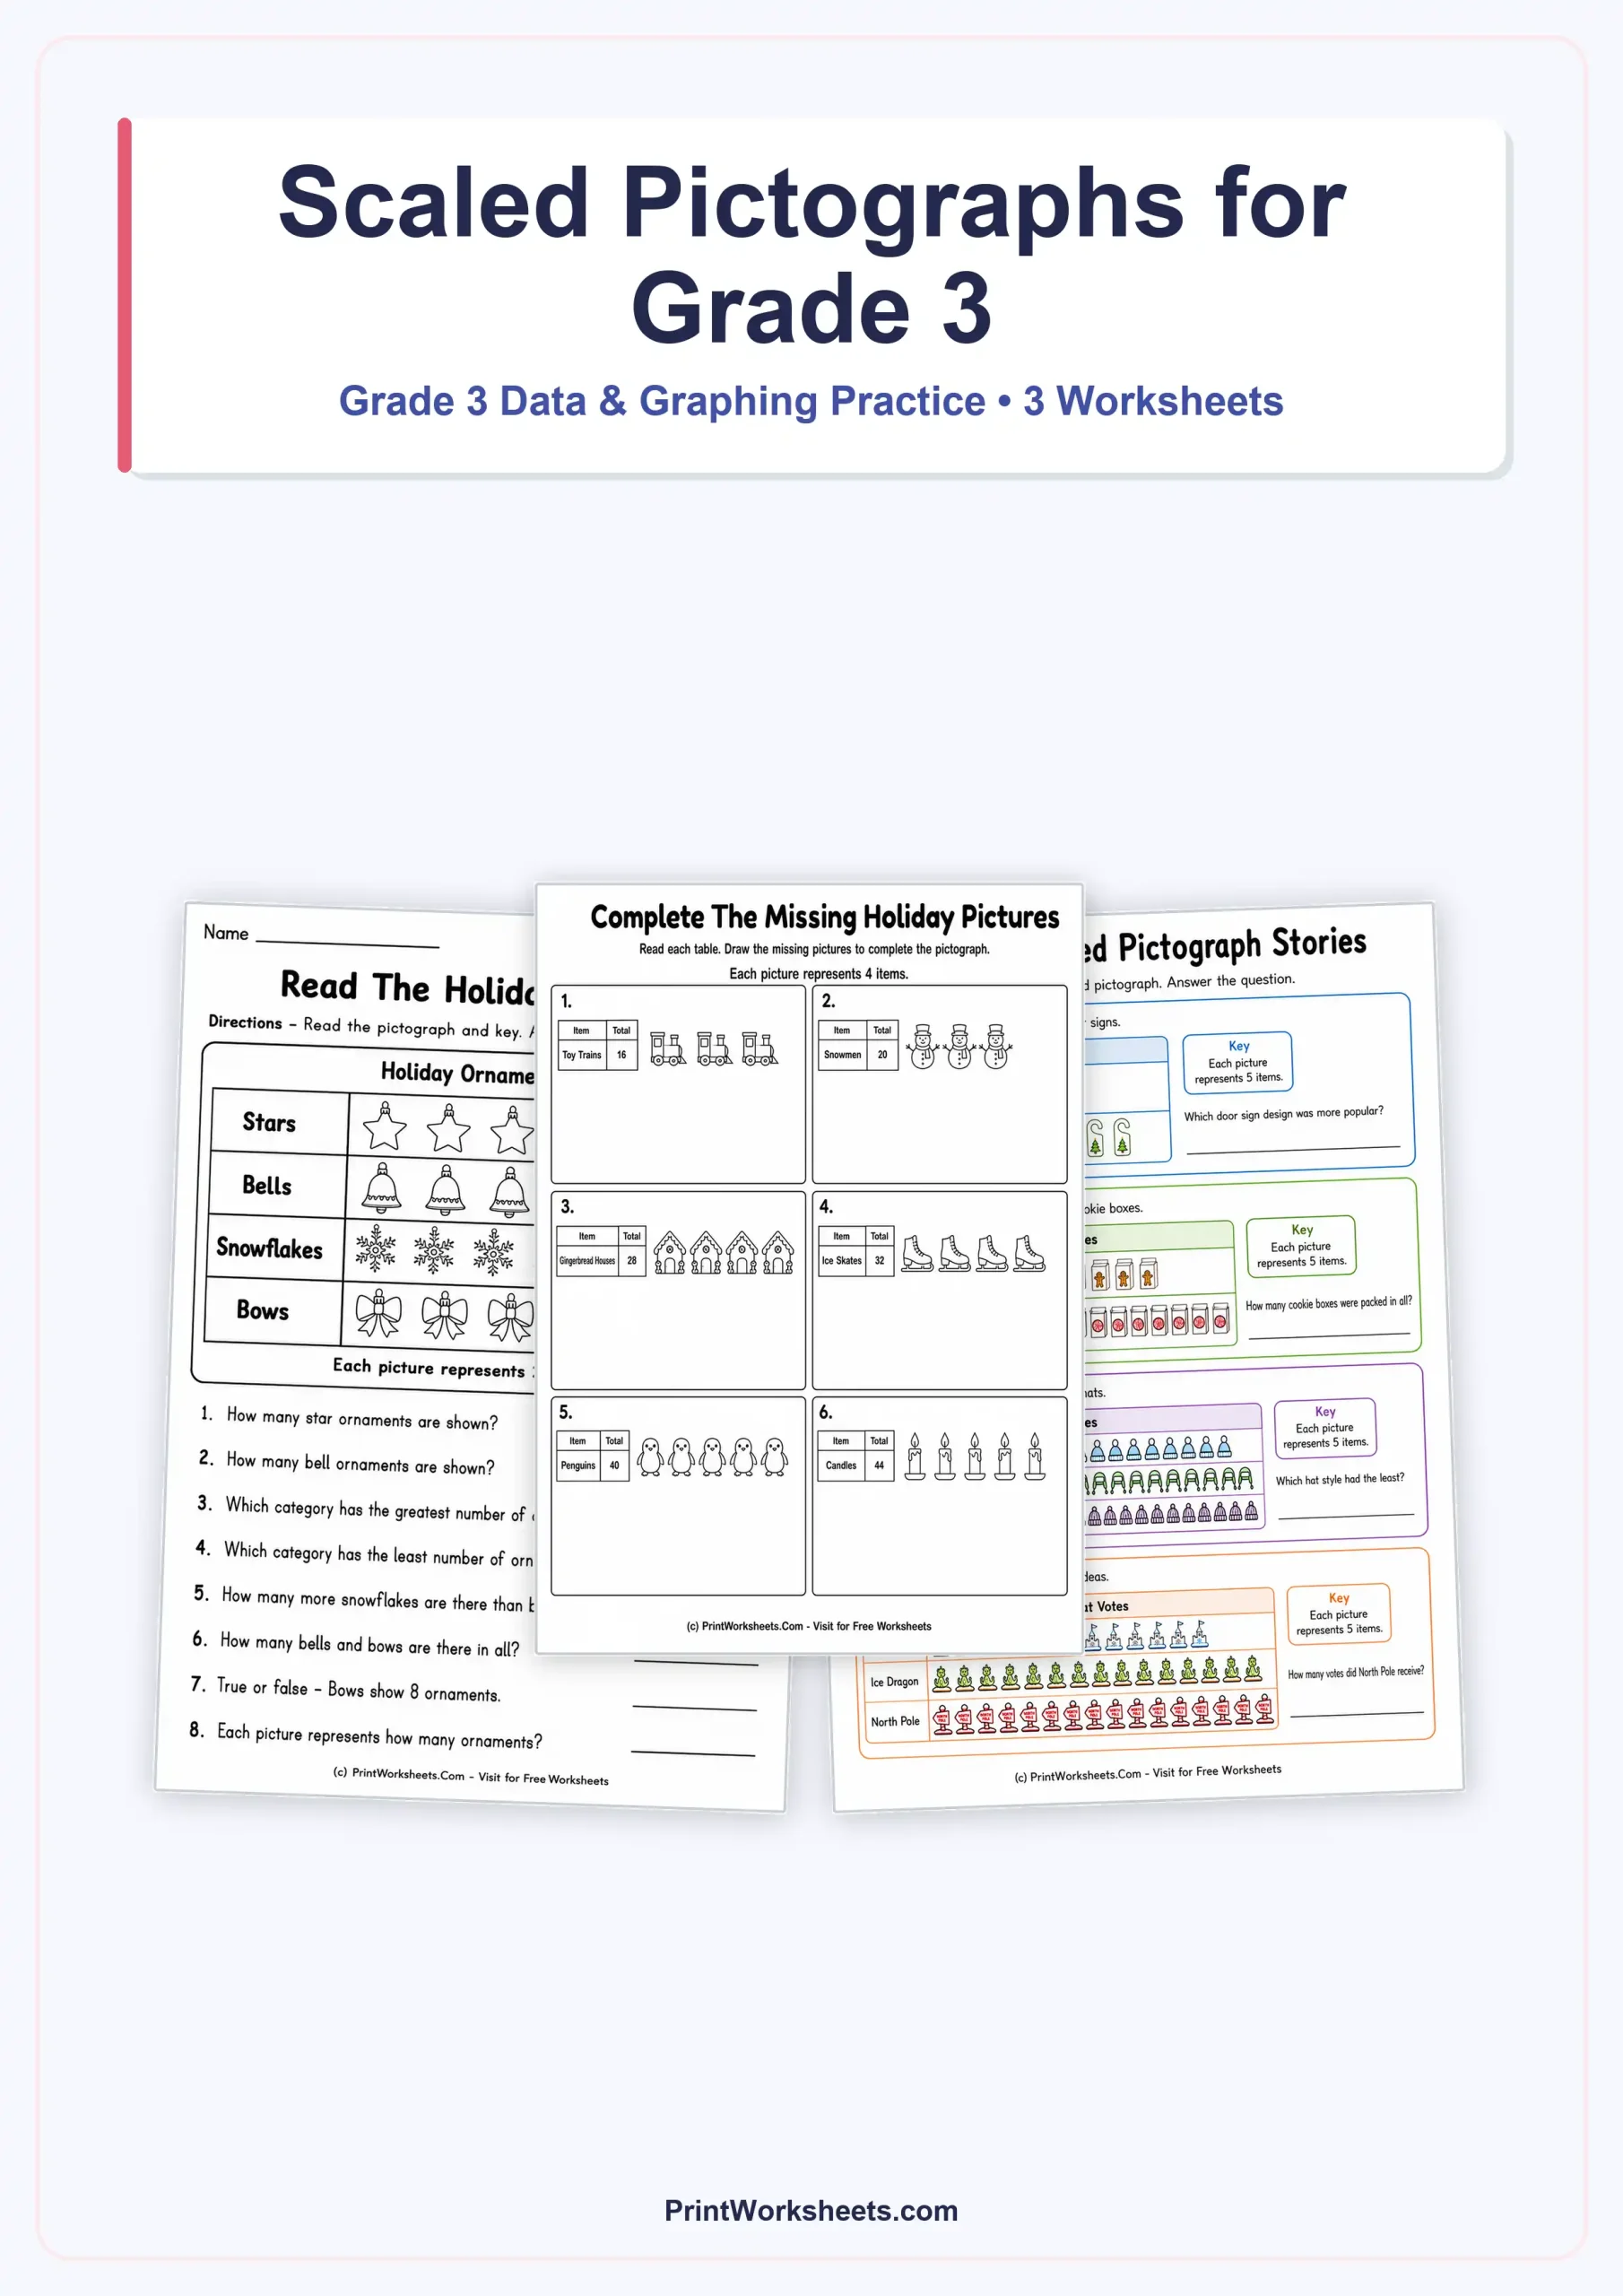
- Picture Graphs (Pictographs): Ideal for kindergarten and 1st grade, where one picture represents one unit of data.
Interactive Data Collection Activities
Learning shouldn't be passive. Many of our printables go beyond reading pre-made charts. They instruct students to collect real-world data from their own environment—such as counting colors in a bag of candy, surveying classmates about their favorite pets, or rolling dice—and then transfer that information into a graph they build themselves. This hands-on approach solidifies the connection between raw numbers and visual representation.
Grade-Level Progression: From Tallying to Line Plots
Not sure where to start? We’ve organized our graphing resources to match standard math curricula. Here is how your child can progress through the skill:
- Kindergarten & 1st Grade: Focus on sorting objects by color and shape, counting with tally marks, and reading simple pictographs.
- 2nd & 3rd Grade: Introduction to bar graphs and basic line plots. Students learn to interpret data by answering "how many more" and "how many less" questions.
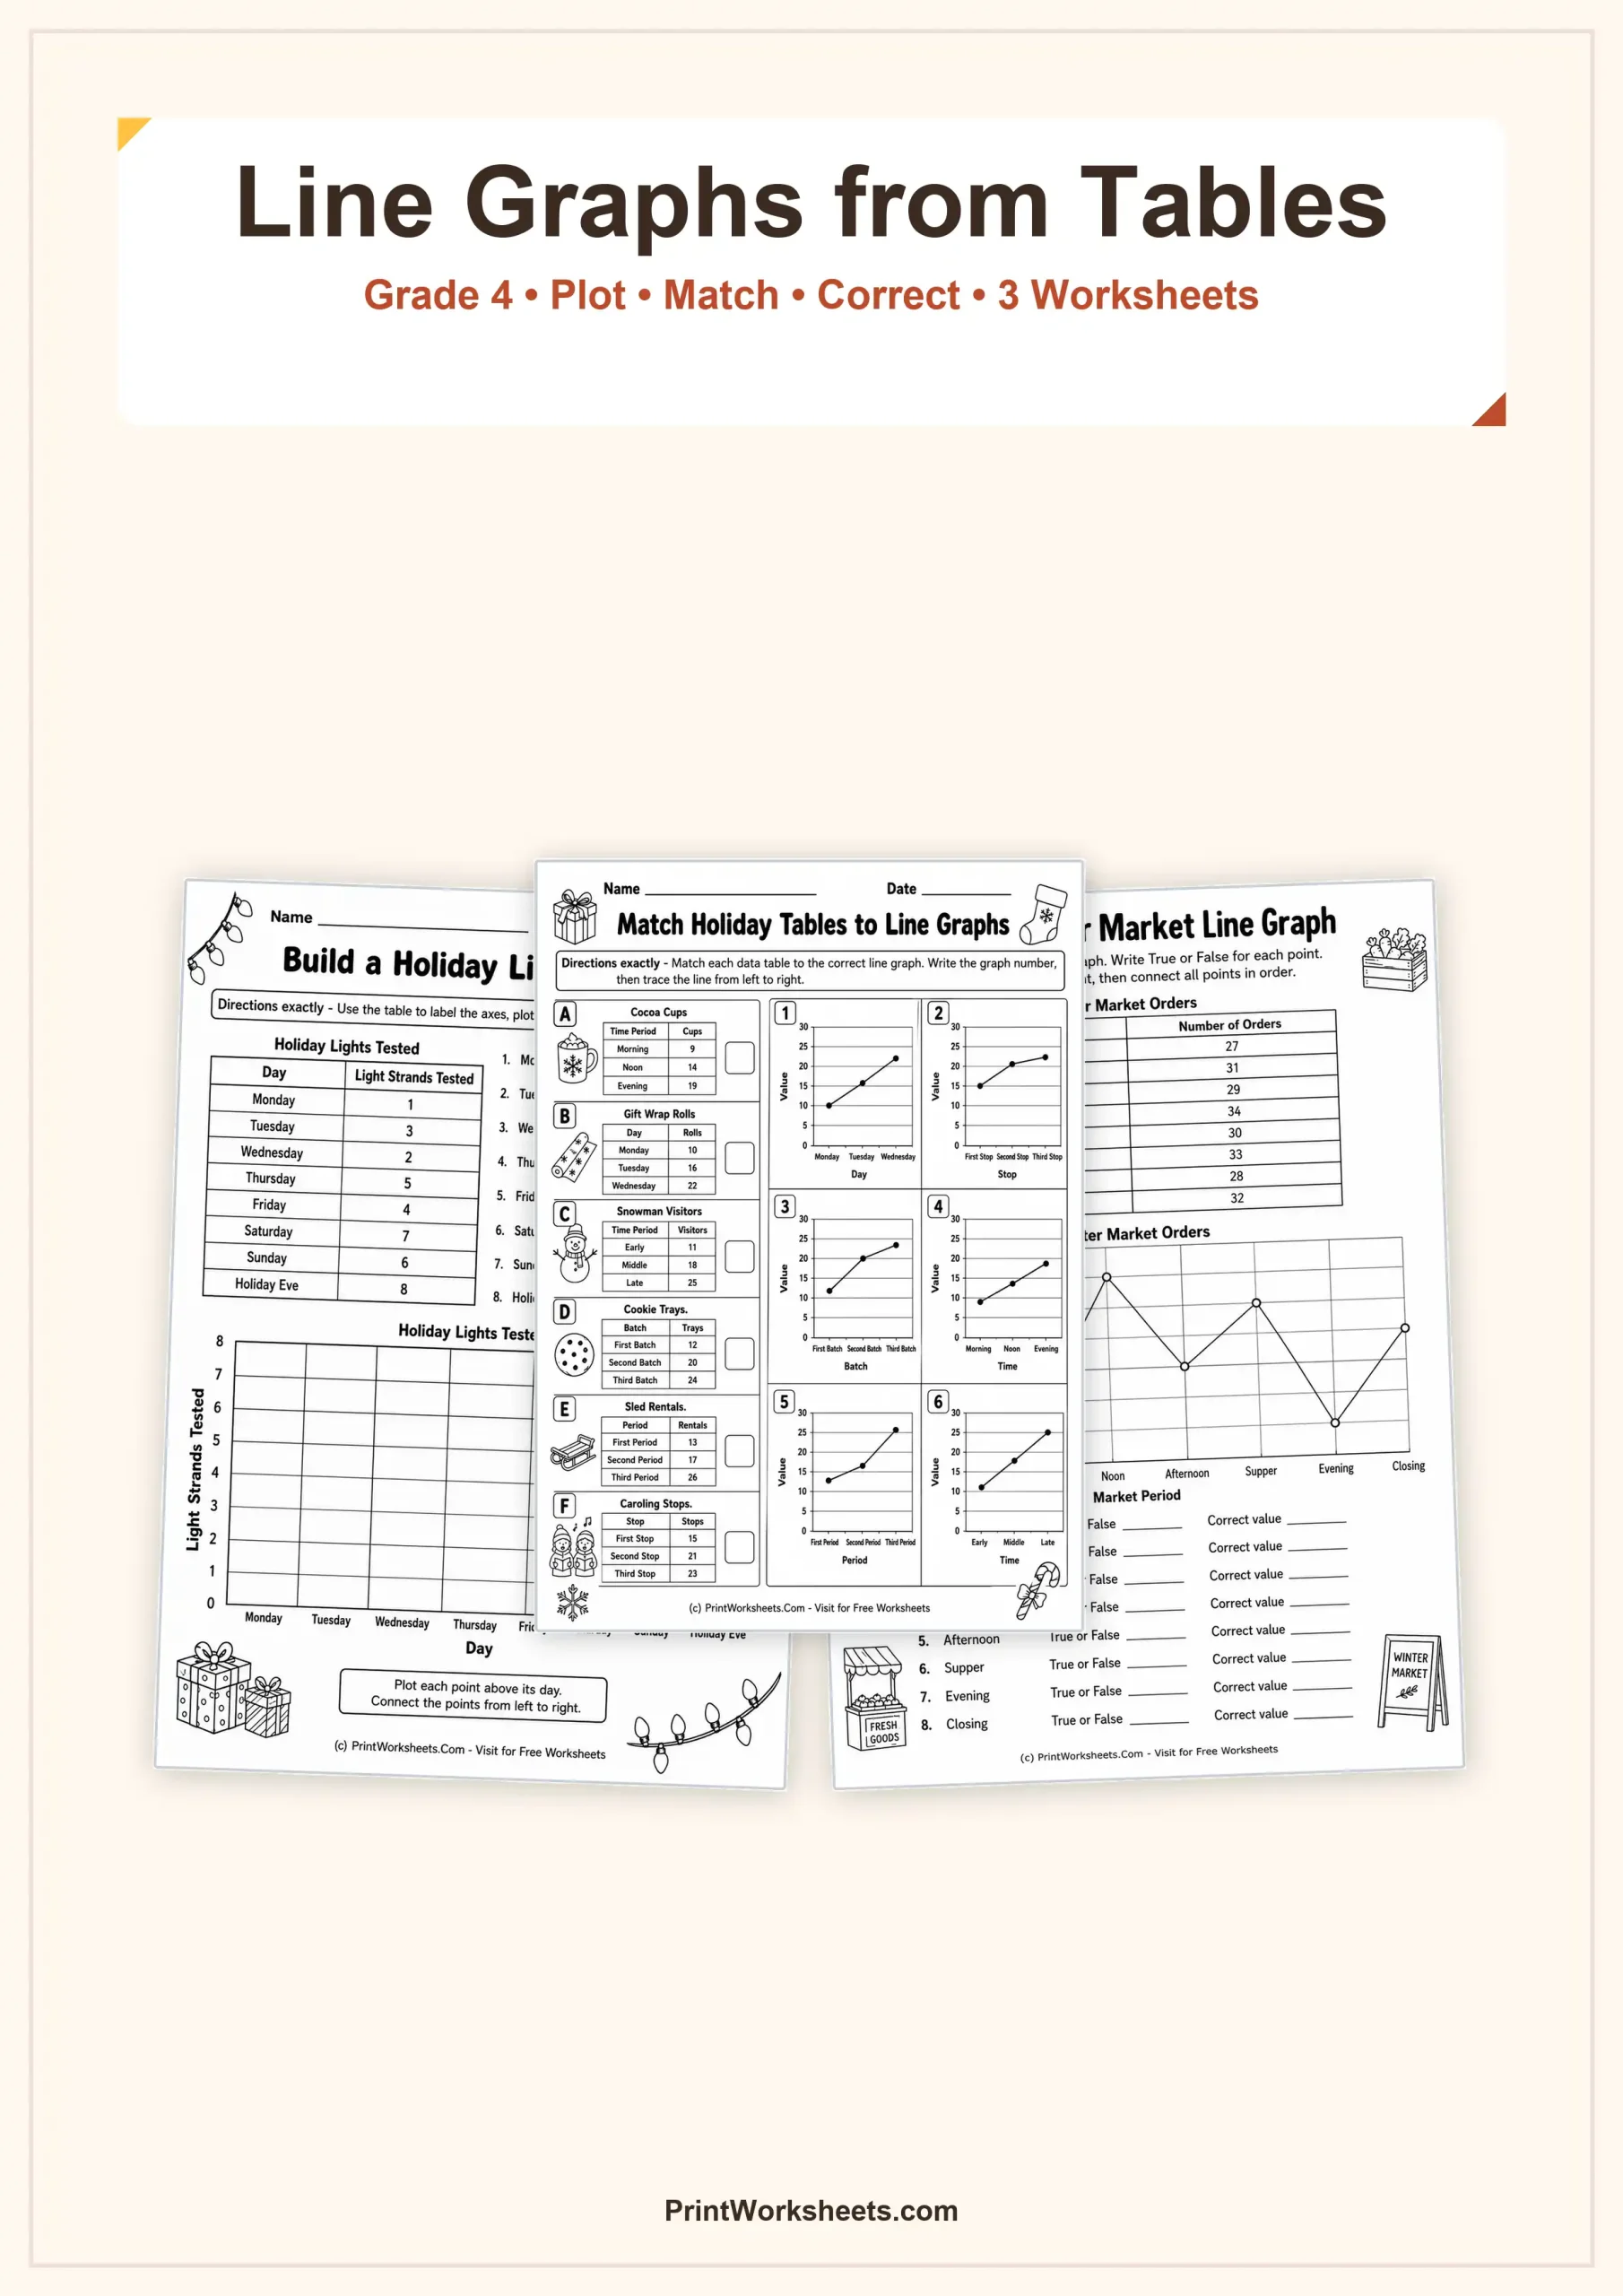
- 4th & 5th Grade: Mastery of double-bar graphs, complex line plots with fractions, and pie charts. Emphasis is placed on analyzing data and drawing conclusions.
Building Analytical Vocabulary
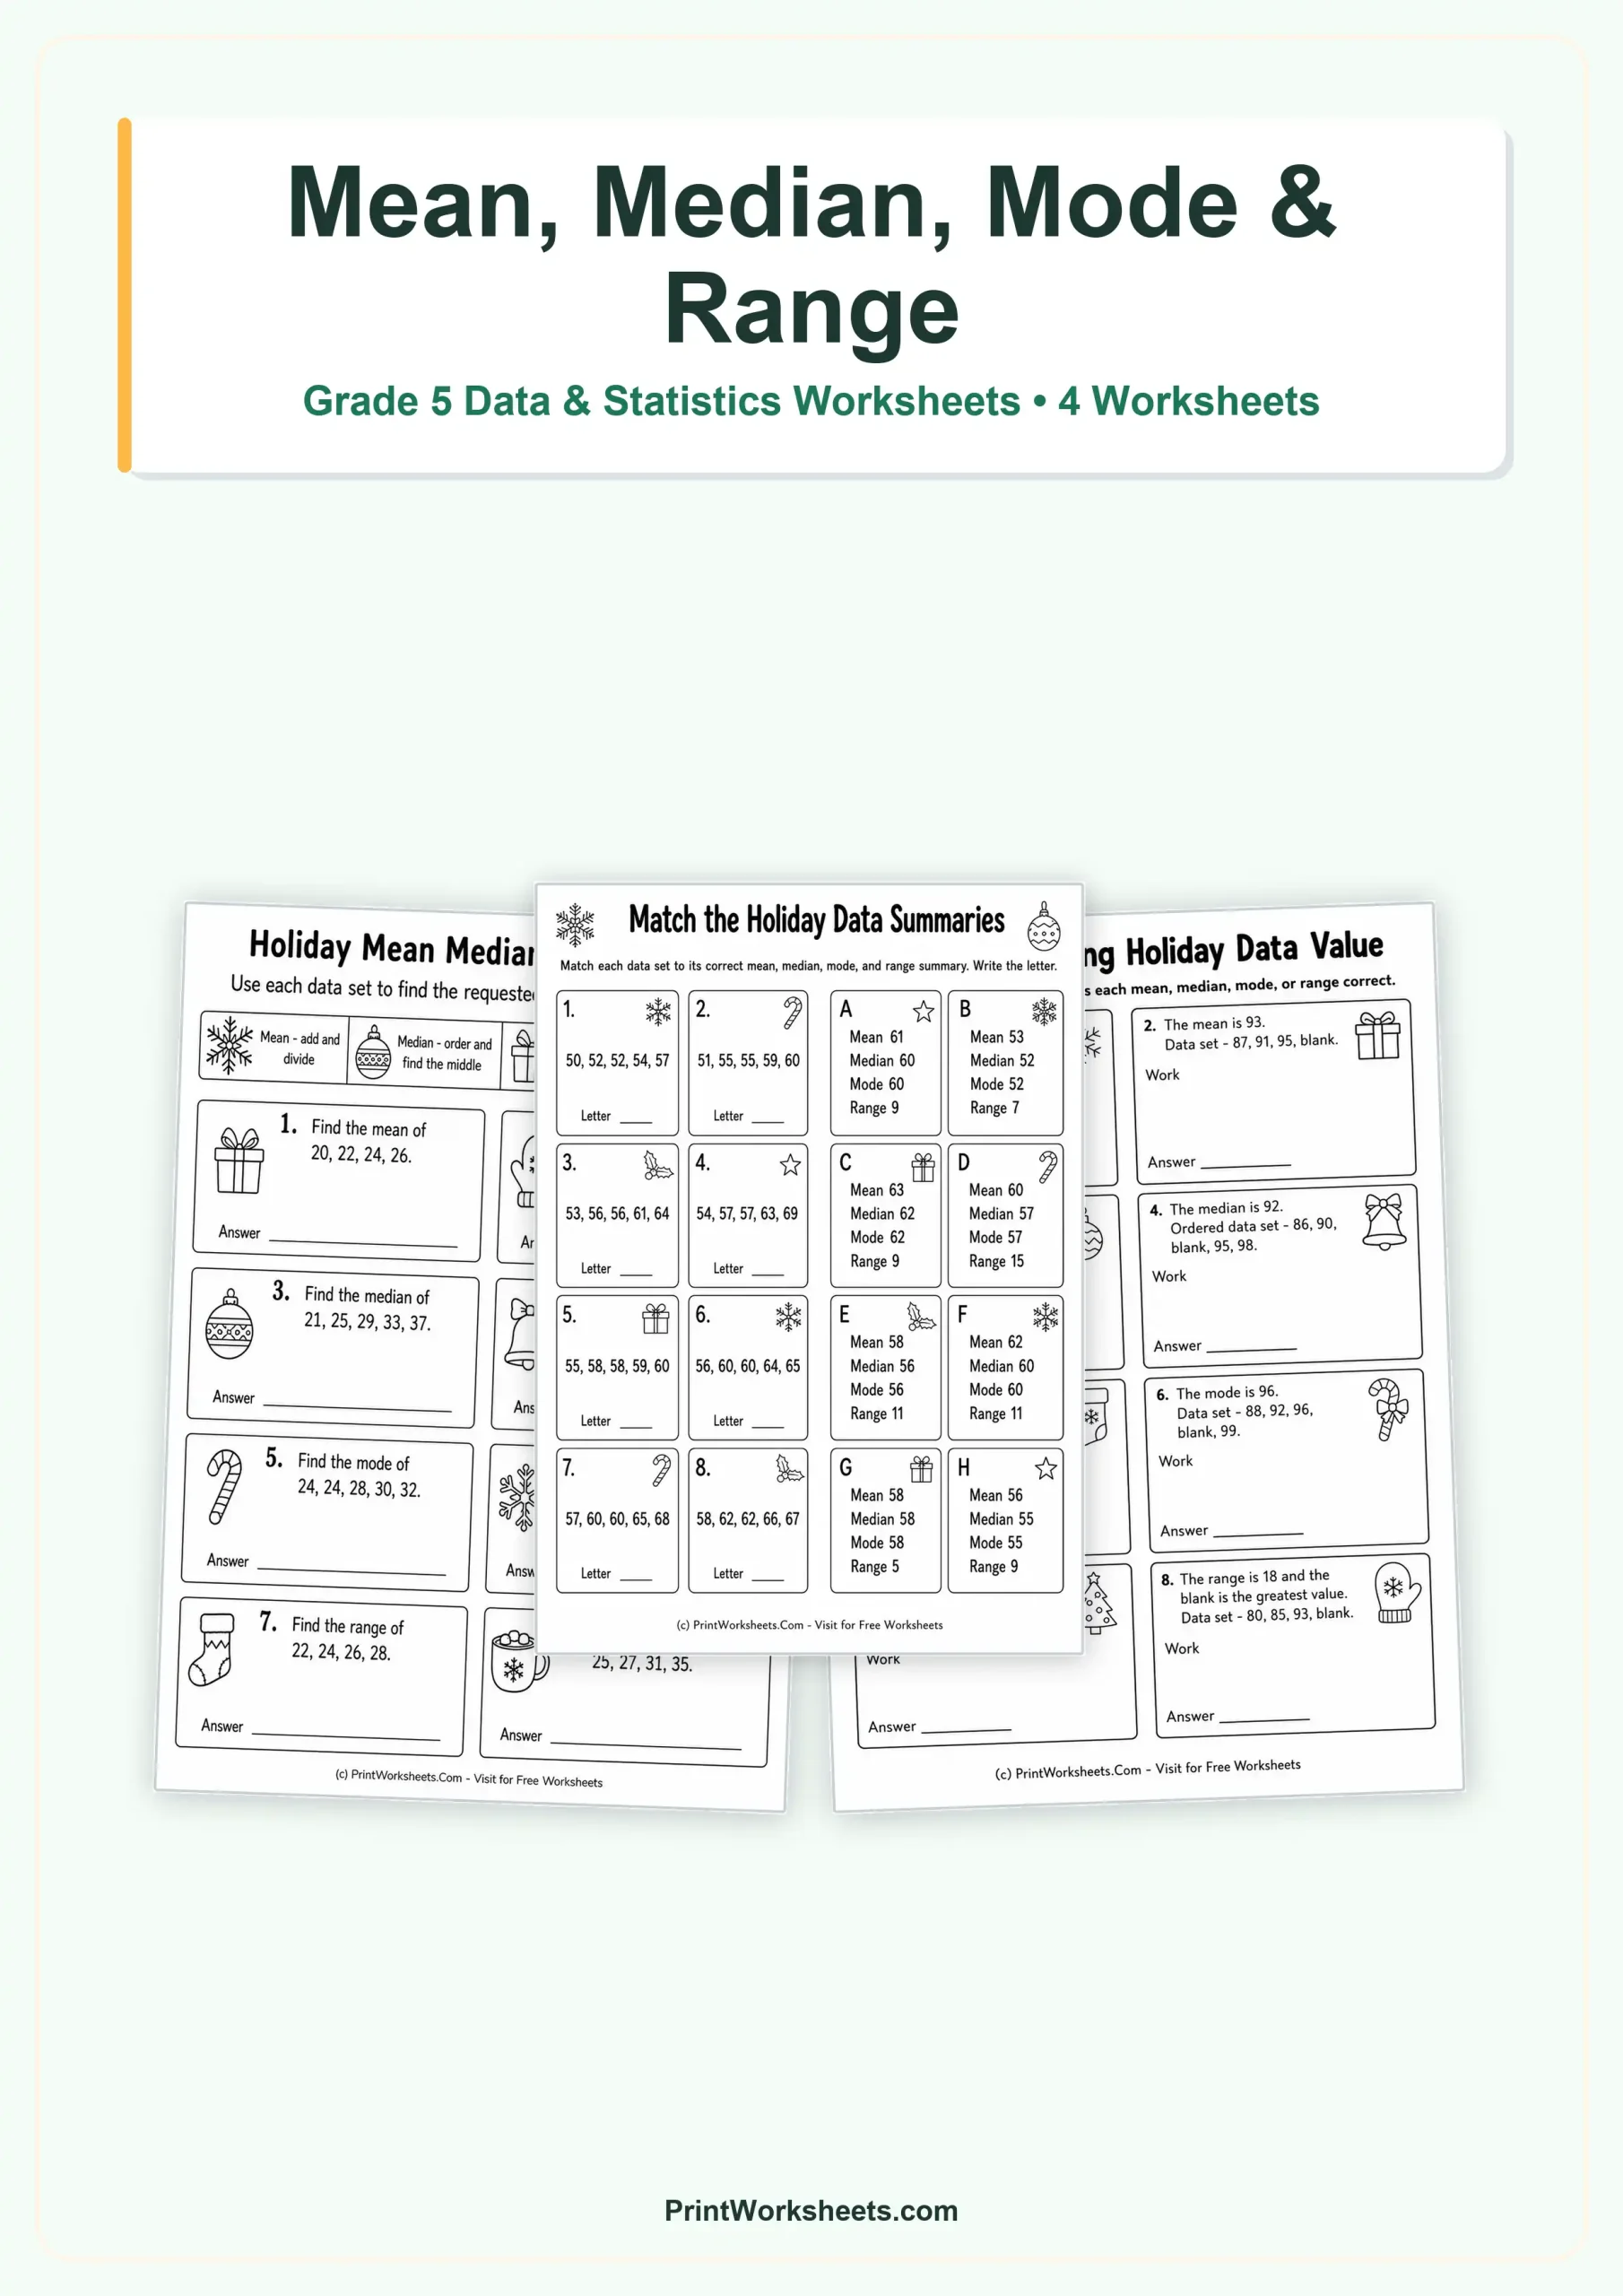
A key part of data literacy is speaking like a mathematician. Our worksheets include guided questions that require students to identify the maximum, minimum, range, and mode of a data set. By repeating these terms in different visual contexts, students naturally build a strong statistical vocabulary.
Common Questions About Teaching Data and Graphing
How do I make graphing fun for kids?
The secret to successful graphing lessons is relevance. Children engage deeply when they are graphing data that matters to them. Use our blank graph templates to track weather patterns for a week, monitor daily classroom attendance, or graph the scores of their favorite sports team. When kids are emotionally invested in the data, the math becomes a game rather than a chore. Our printables provide the structure, but you provide the exciting context!
What is the difference between a Bar Graph and a Histogram?
While they look similar, they serve different purposes. A bar graph is used to compare categories (e.g., favorite ice cream flavors) and typically has spaces between the bars. A histogram is used to show the distribution of numerical data ranges (e.g., test scores) and usually has no spaces. For elementary students, mastering bar graphs, pictographs, and line plots is the priority before moving on to histograms in middle school.
Why is learning to use Tally Marks important?
Tally marks are the foundation of data collection. They teach students one-to-one correspondence (one mark equals one item) and introduce skip counting by 5s. Before a child can input data into a software program or draw a complex graph, they must be able to efficiently record raw data. Tally mark practice builds the accuracy and speed needed for later math success.
Why Choose Our Printable Data and Graphing Activities?
Teachers and homeschool parents choose PrintWorksheets.com for our clean layouts and logical scaffolding. Unlike cluttered digital games, our black-and-white printables are distraction-free, printer-friendly, and perfect for homework packets or quiet morning work. Every worksheet is crafted to build confidence, ensuring students understand not just the "how" of graphing, but the "why."
Ready to Start Graphing?
Browse the thumbnails below to find the perfect data and graphing worksheet for your student. Whether you need a quick 5-minute warm-up or a full lesson plan supplement, you’ll find hundreds of resources available for instant download and printing. Start turning your students into data detectives today!