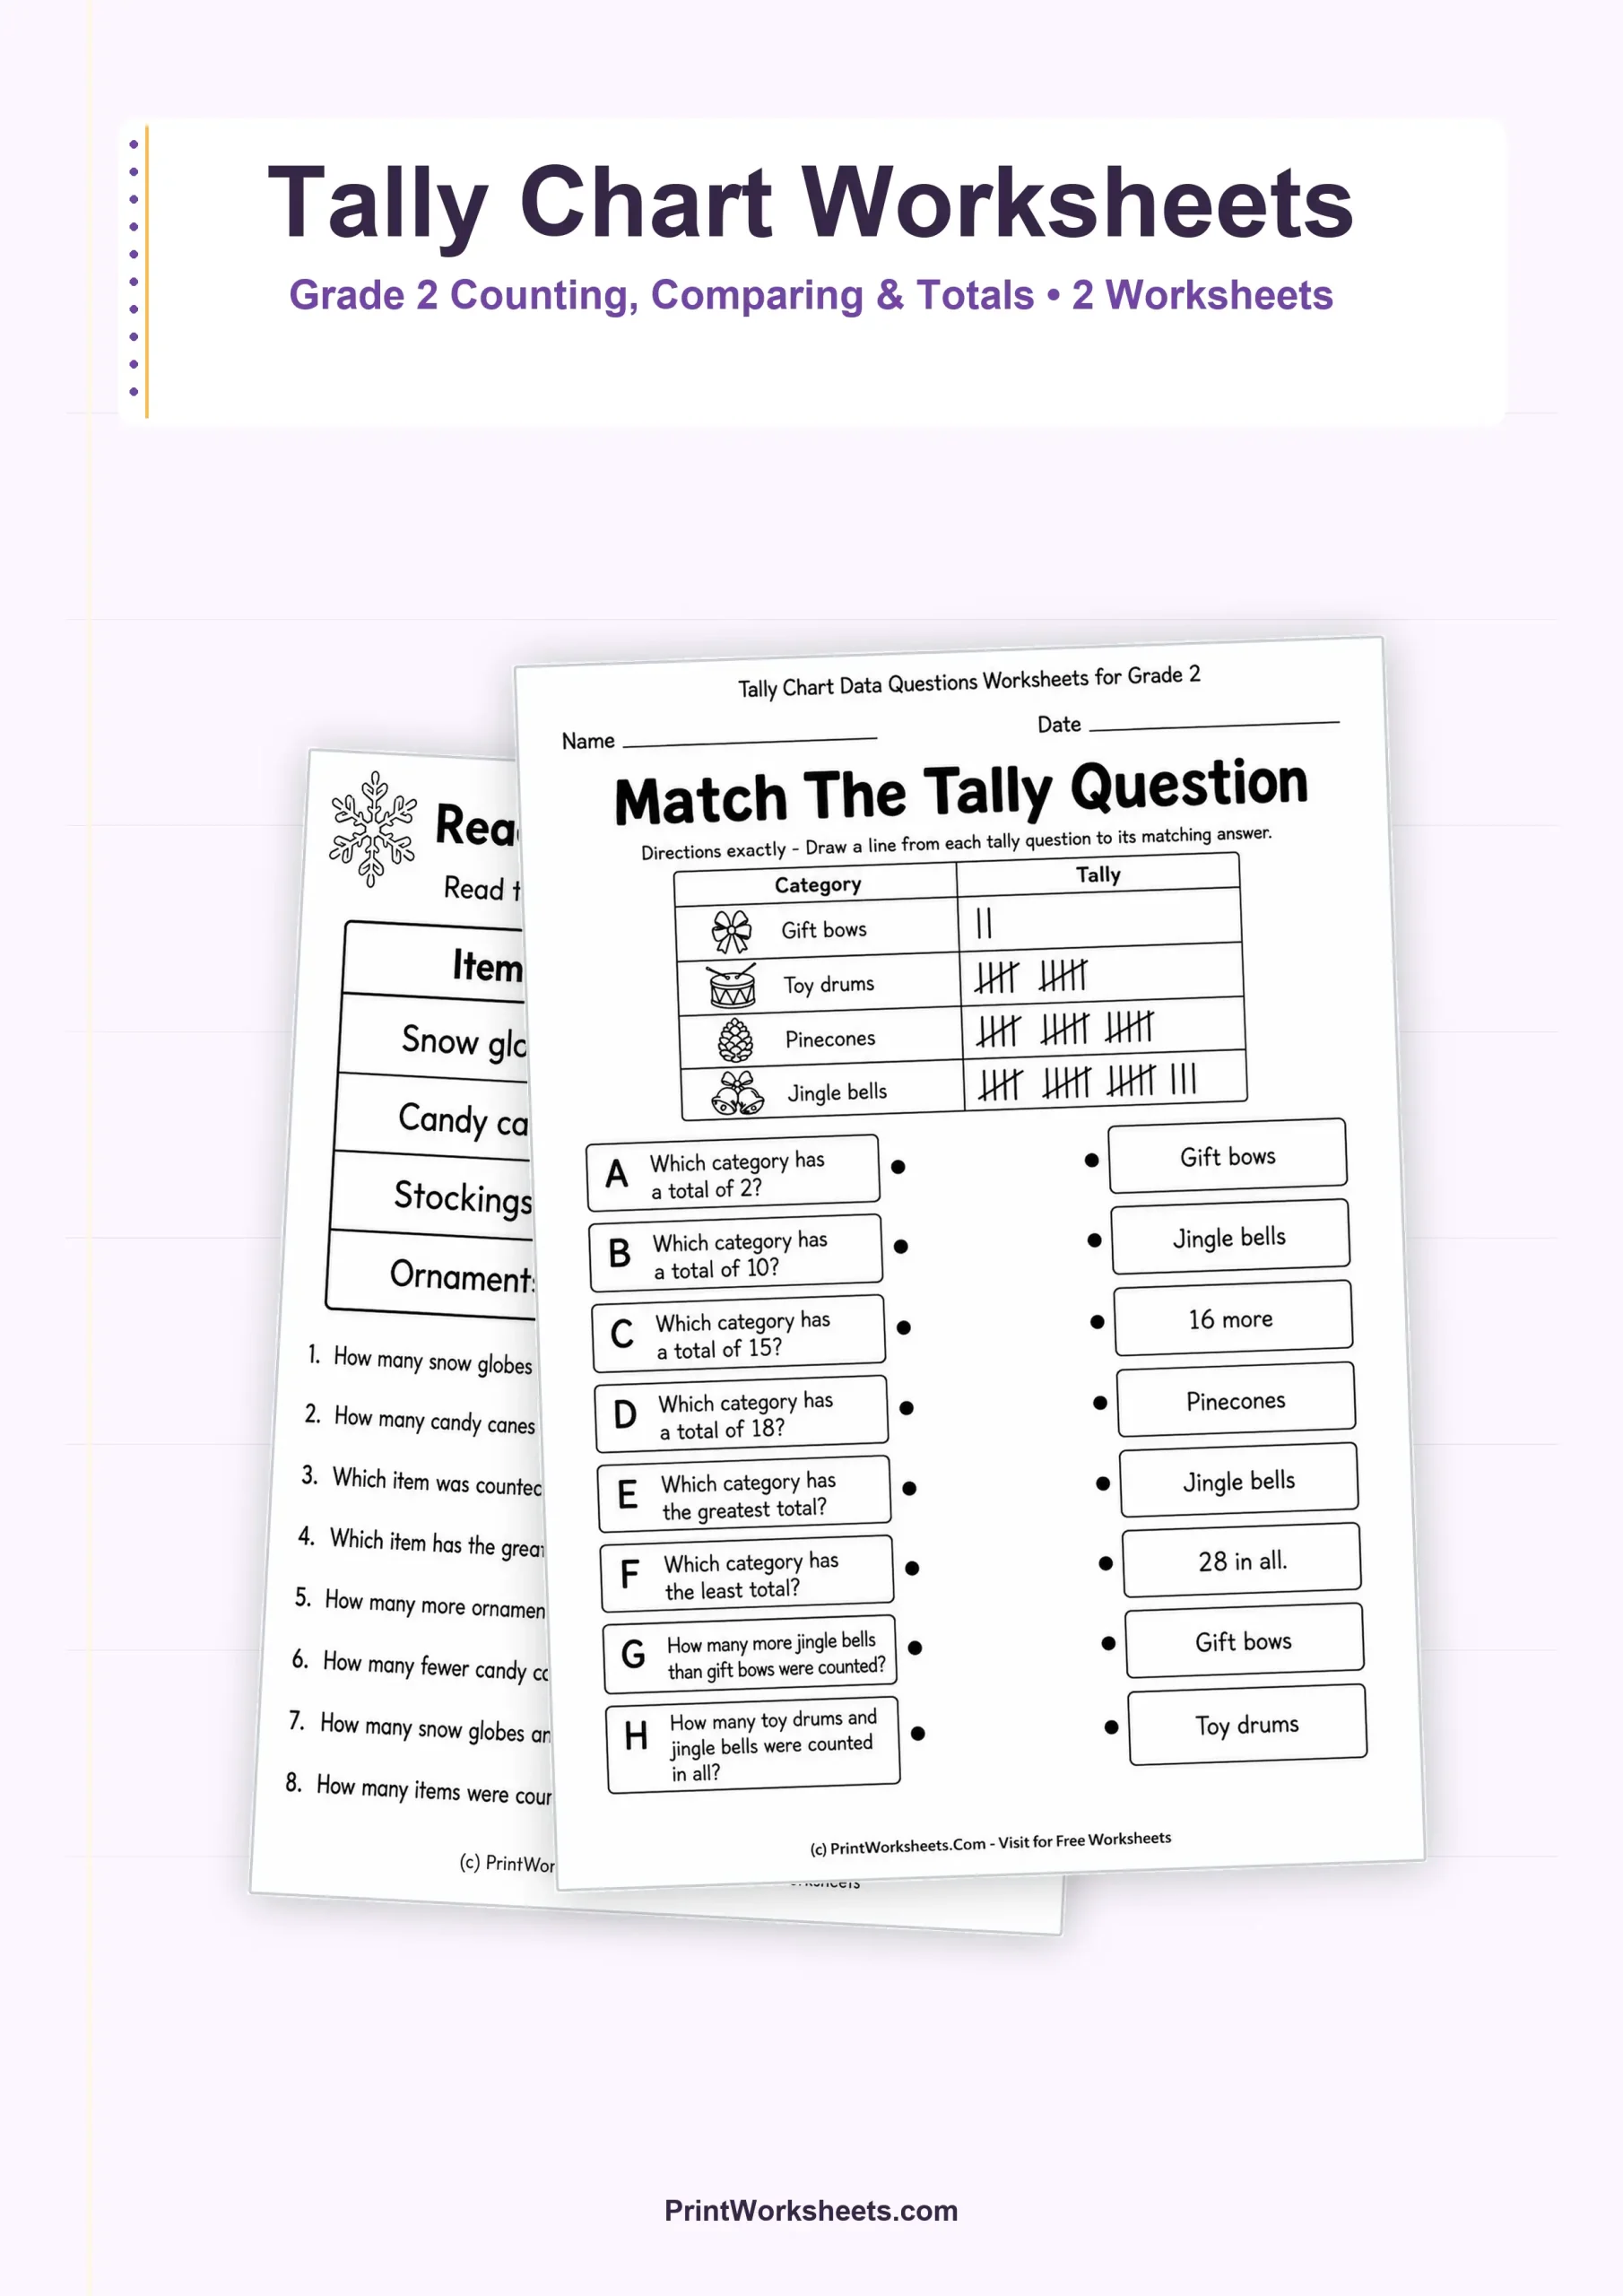
These tally chart worksheets give second graders practice turning groups of tally marks into useful information. Instead of stopping after a simple count, students use the data to answer questions about totals, greatest and least values, differences, and combined amounts. The two printable activities use familiar holiday-themed categories, making the numbers easy to locate while keeping the mathematical thinking focused on reading and interpreting tally data.
Tally Chart Worksheets for Grade 2 Data Practice
Both worksheets ask students to read tally marks in groups of five and connect those marks to written questions. This is an important step between basic counting and more formal graph interpretation. Students need to recognize a complete group of five, add any extra marks, compare category totals, and decide which operation a question is asking for.
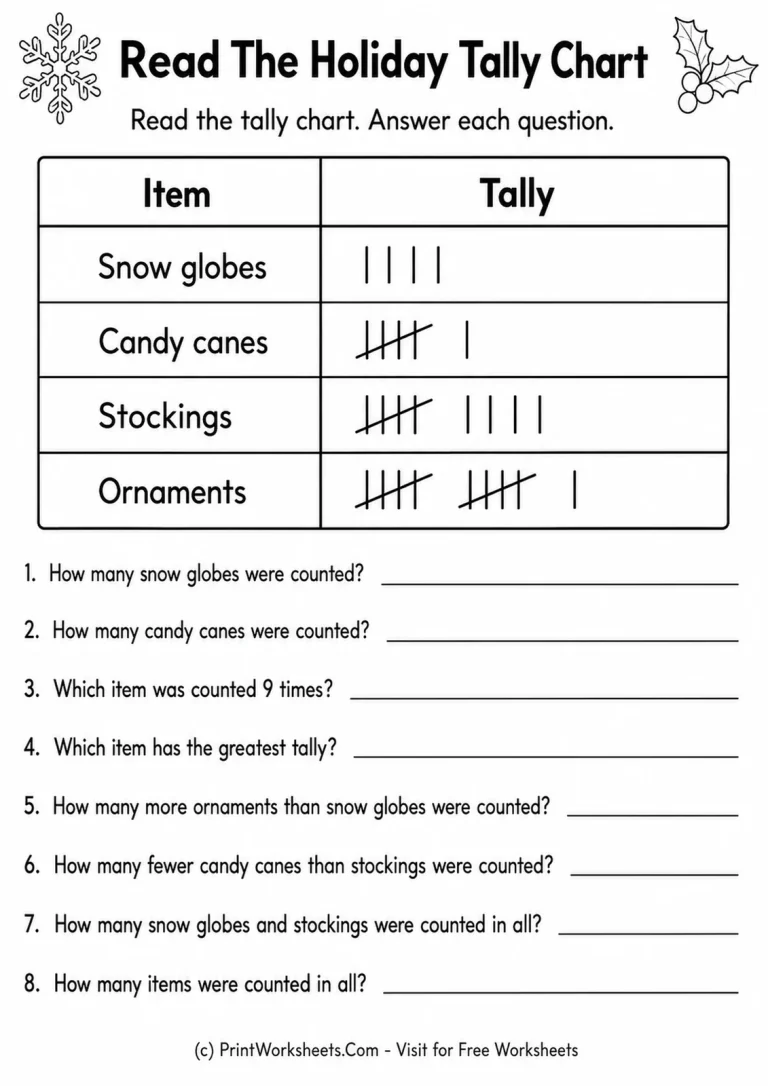
The first worksheet, Read The Holiday Tally Chart, uses four categories: snow globes, candy canes, stockings, and ornaments. After studying the chart, students answer eight open-response questions. Some questions ask for a direct count, while others ask which category was counted a certain number of times or which item has the greatest tally. The final questions move into addition and subtraction language by asking how many more, how many fewer, and how many items were counted in all.
Two Different Ways to Read and Interpret Tally Data
Open-response questions from one complete chart
The first page is useful when students are ready to explain the result themselves rather than choose from options. Because all four categories stay visible at the top of the page, children can return to the same data set for several kinds of questions. That repeated reference encourages careful chart reading and helps students see that one tally chart can answer many different mathematical questions.
The data also provides a manageable progression. Students begin with straightforward counting, then identify a category from its total, locate the greatest tally, compare two categories, and finally combine values. Teachers can use the page as independent practice, a small-group lesson, or a quick check of whether students understand vocabulary such as more, fewer, greatest, and in all.
Matching questions to tally-chart answers
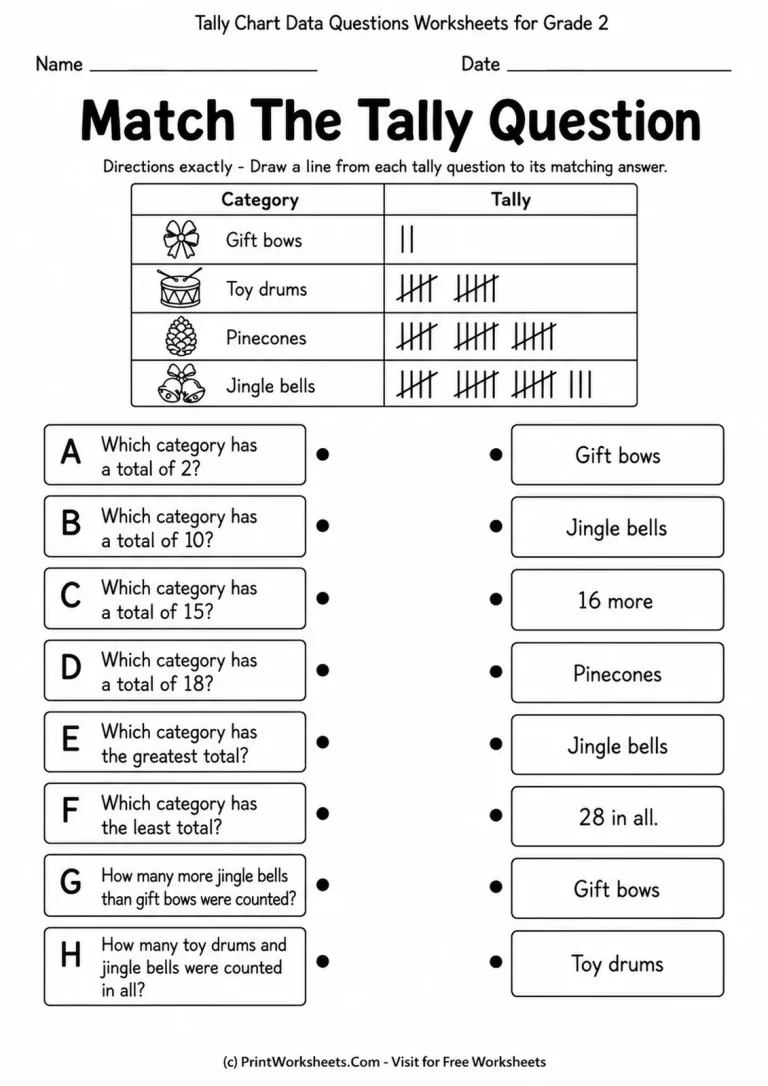
The second worksheet, Match The Tally Question, changes the response format while practicing the same core skill. Students read tally rows for gift bows, toy drums, pinecones, and jingle bells. The visible totals range from a very small count to a larger two-digit count, so students must be comfortable reading several groups of five rather than relying on one-by-one counting.
Eight prompts on the left ask students to identify categories with specific totals, find the greatest and least totals, determine a difference, and combine two categories. Students draw lines to the matching answers on the right. This format is especially helpful for students who understand the data but benefit from a structured response choice instead of writing every answer from scratch.
Skills Students Practice With These Tally Charts
Across the two pages, second graders practice several connected data skills: counting tally marks accurately, recognizing groups of five, matching a numeral to a category, comparing quantities, finding a difference, and adding two category totals. The activities also reinforce mathematical reading. A student must distinguish between questions asking for a category name and questions asking for a numerical result.
If your class is moving through a broader data unit, these pages work well alongside bar graph worksheets with picture data. Students can compare how the same kinds of questions are answered when information is shown with bars instead of tally marks. For another visual representation, try pictograph questions with scales, where students must interpret symbols as well as quantities.
Using the Worksheets in a Grade 2 Data Unit
A practical sequence is to begin with the open-response holiday chart and have students mark each complete group of five before answering. During review, ask them to point to the exact tally row that supports each response. The matching page can then be used for additional practice because it includes larger totals and asks students to connect several question types with their answers.
These worksheets can also prepare students for other Grade 2 graph formats. After tally charts feel secure, line plot worksheets with whole-number measurements provide a natural next step in reading repeated data values from a different display. Together, the activities help students understand that charts and graphs are not just pictures of numbers; they are tools for answering questions about data.
Use these tally activities when students need short, focused practice that goes beyond counting marks. With one open-response page and one matching page, the set gives children two ways to demonstrate that they can read a tally chart, compare categories, and use the displayed data to solve simple Grade 2 questions.