Students often understand a bar graph more deeply when they have to build it from a table instead of only answering questions about a finished graph. These bar graphs from tables worksheets for Grade 2 give students repeated practice turning category-and-number data into bar heights, checking whether a graph matches its source table, and using the finished graph to make simple comparisons. Across four student pages, the activities move from straightforward graph construction to missing-bar completion, error correction, and short story-based graphing.
Practice Creating Bar Graphs from Tables
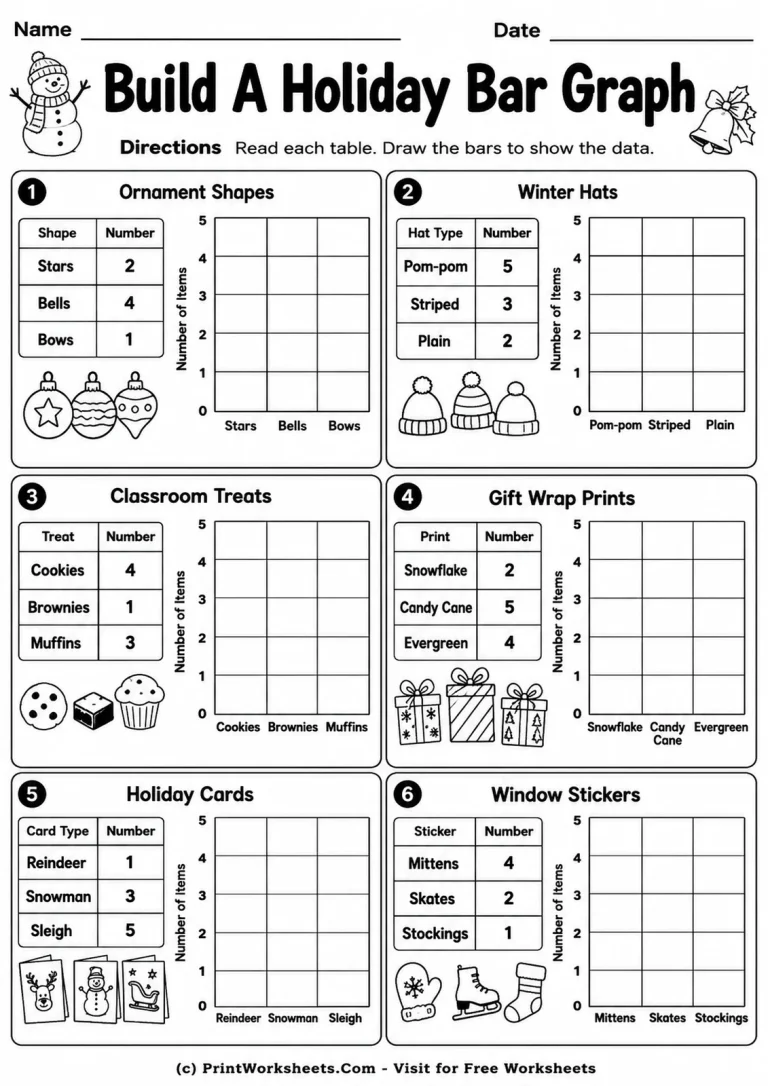
The first worksheet is a direct table-to-graph activity with six compact data sets. Students read values for ornament shapes, winter hats, classroom treats, gift wrap prints, holiday cards, and window stickers, then draw three bars for each set. The graphs use a 0–5 scale, so children can focus on matching each category to its correct value without handling large numbers. Examples include Stars 2, Bells 4, and Bows 1, as well as Pom-pom 5, Striped 3, and Plain 2.
This page is useful when students are first learning that a bar graph is another way to display the same information already shown in a table. The category labels stay visible under each graph, and the vertical axis gives a clear number scale. Students must coordinate three pieces of information at once: the category name, the table value, and the height of the bar.
Build Accuracy with Missing and Incorrect Bars
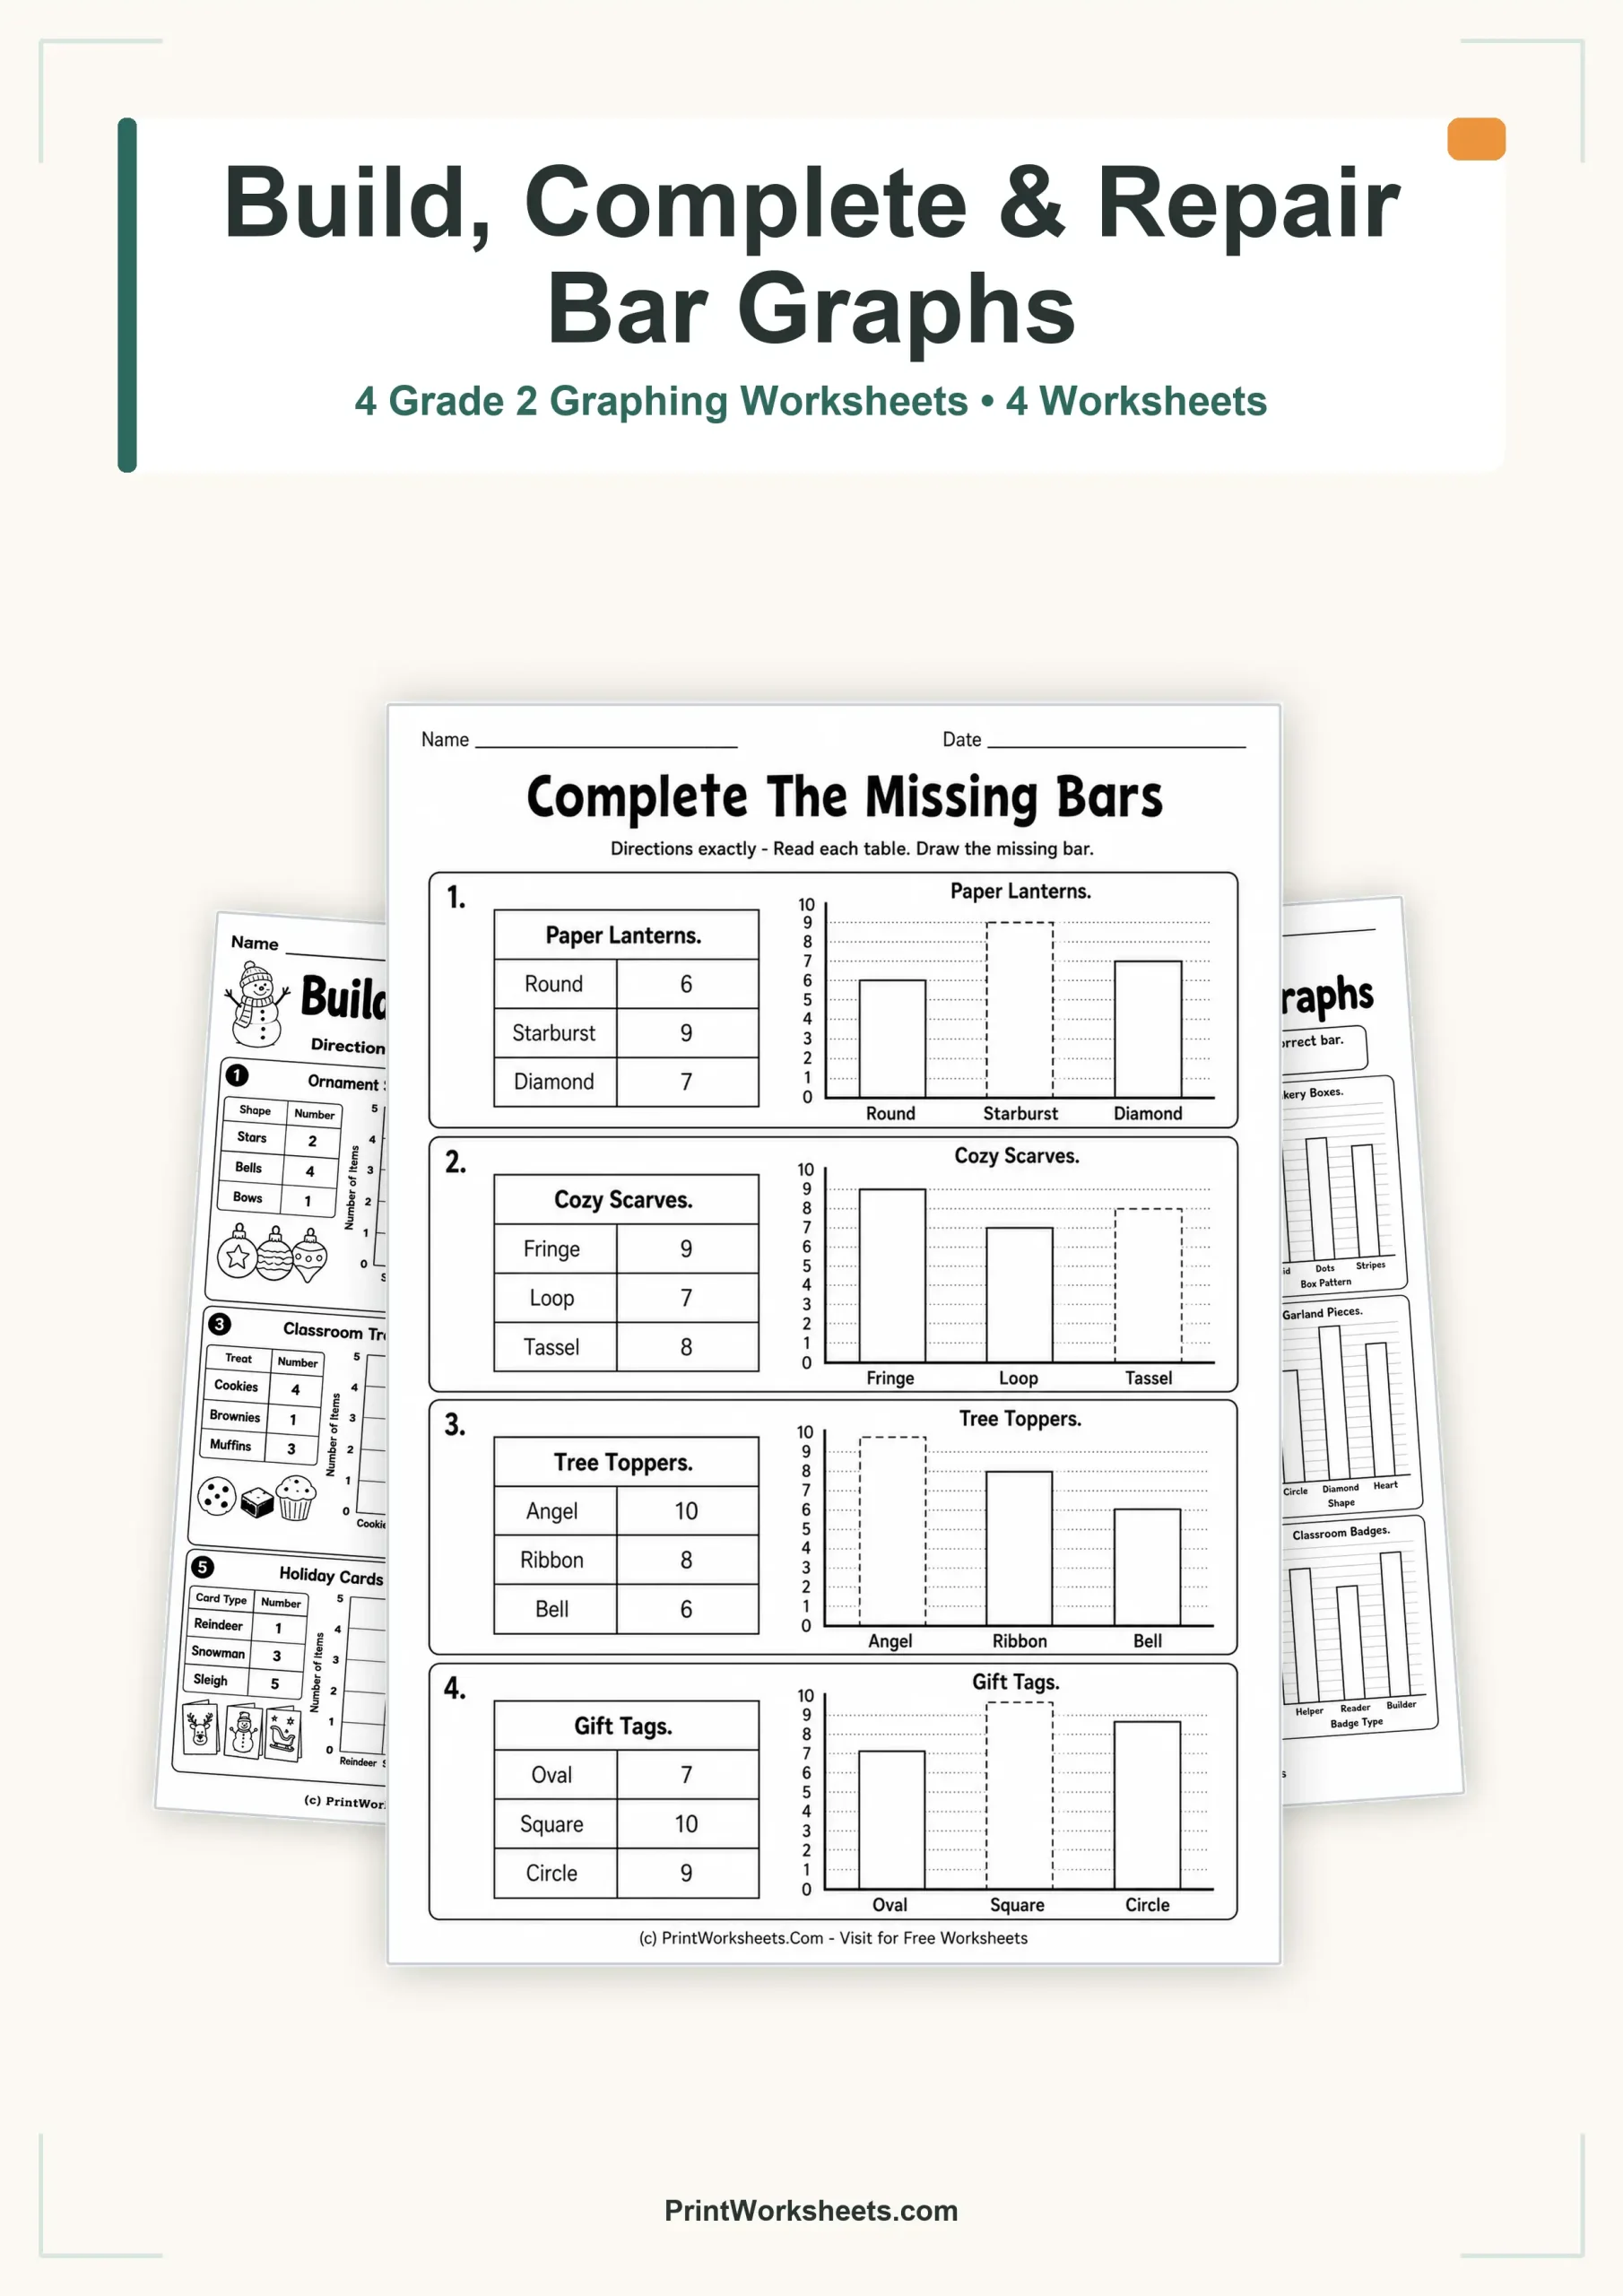
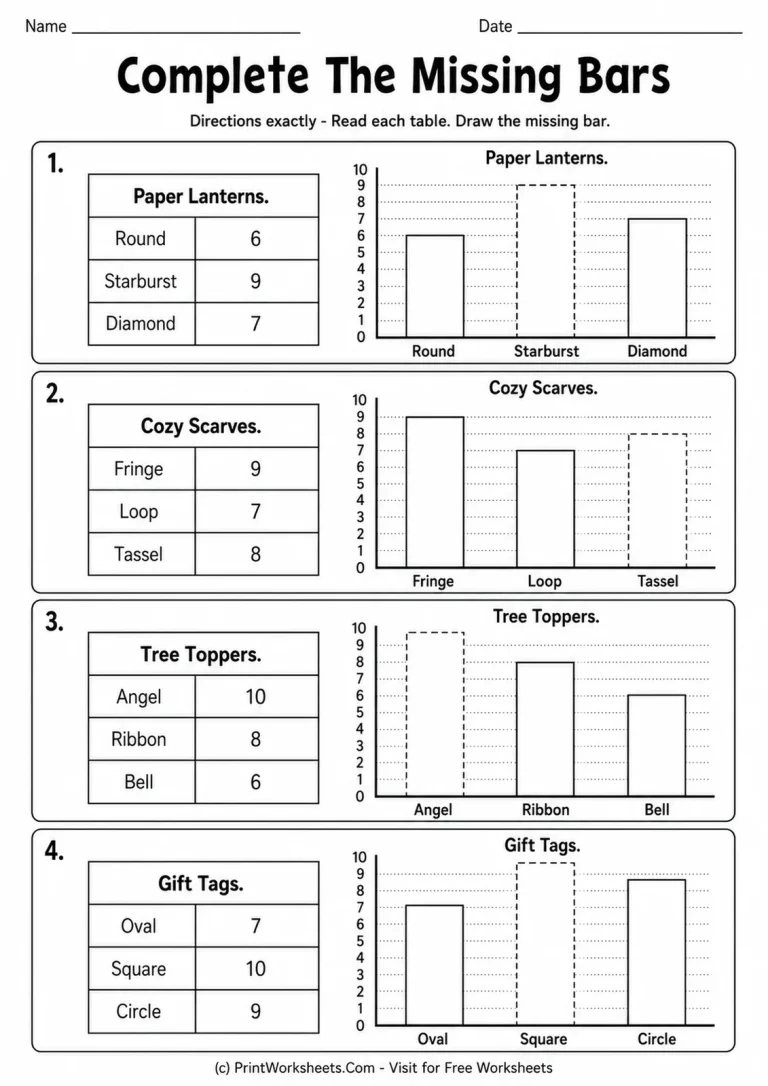
The second worksheet changes the task by showing partially completed graphs. Each of four tables has one missing bar for students to draw. The contexts are Paper Lanterns, Cozy Scarves, Tree Toppers, and Gift Tags, with scales running from 0 to 10. Students complete values such as Starburst 9, Tassel 8, Angel 10, and Square 10 while using the already drawn bars as reference points.
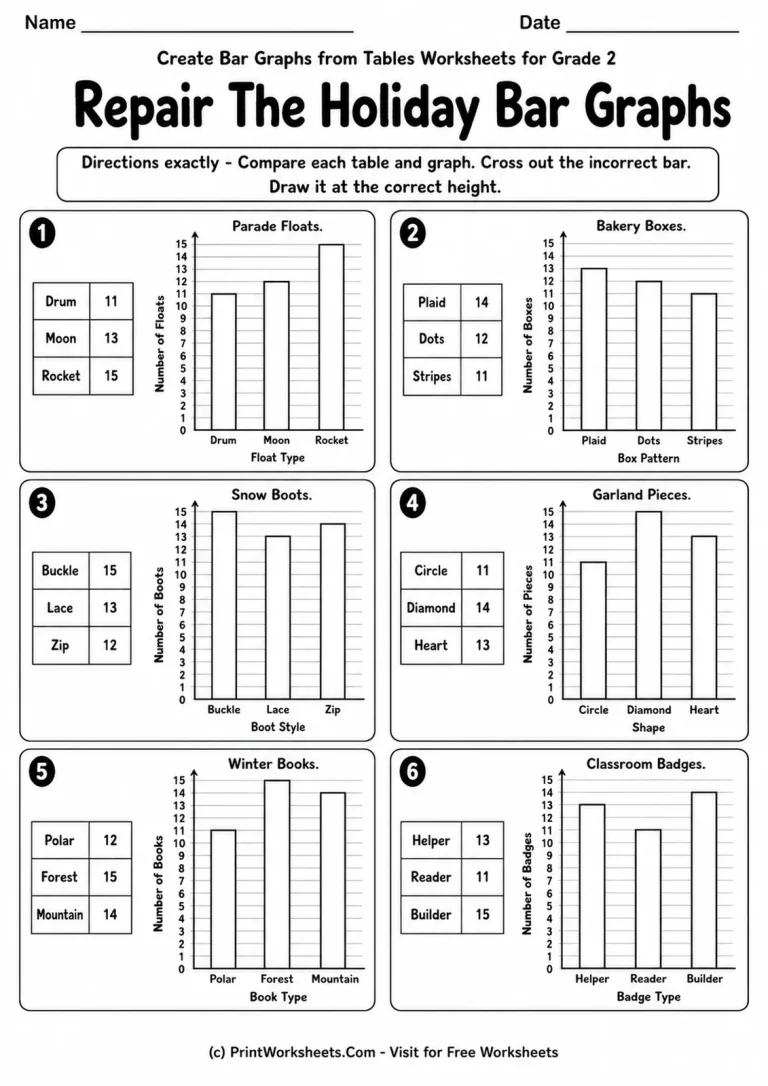
The third worksheet asks students to become graph detectives. Each table is paired with a graph containing one incorrect bar. Students compare the two representations, cross out the incorrect bar, and redraw it at the correct height. The six sections use values up to 15 and include Parade Floats, Bakery Boxes, Snow Boots, Garland Pieces, Winter Books, and Classroom Badges. This is a stronger checking task because students cannot simply copy every number; they must identify which bar does not agree with the table.
From Graph Construction to Data Comparison
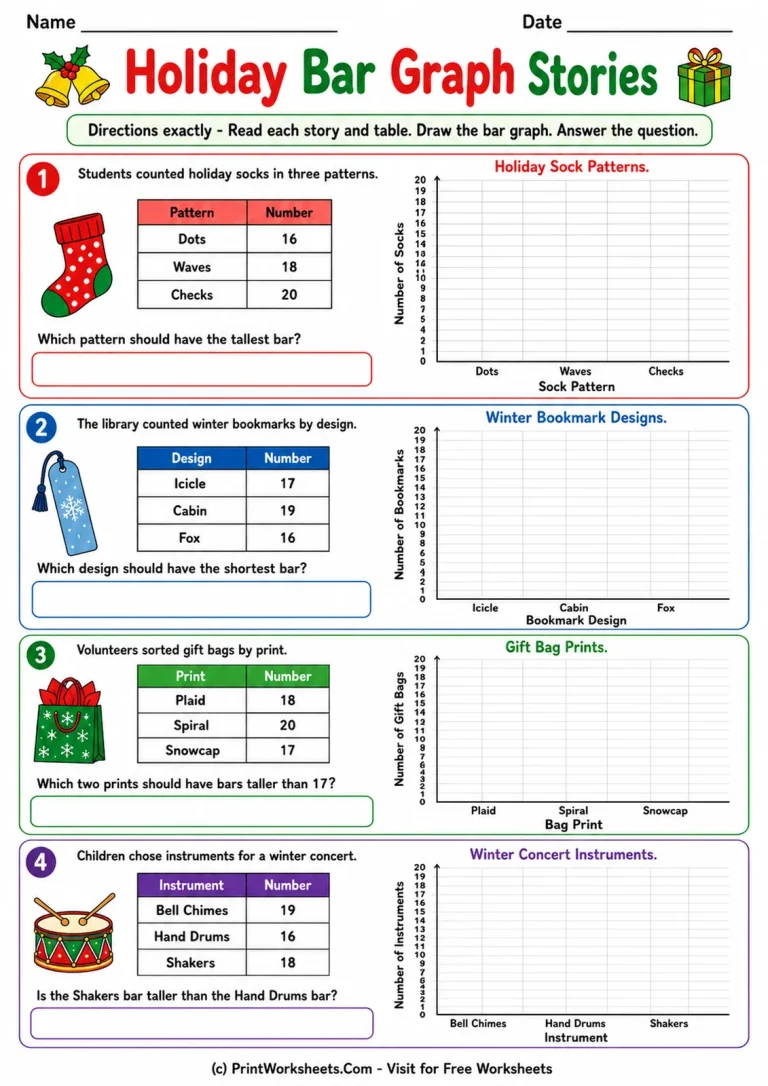
The fourth worksheet combines graphing with short reading prompts. Students read four brief winter or holiday situations, use the accompanying tables to create three-bar graphs on a 0–20 scale, and then answer a comparison question. They determine which sock pattern should have the tallest bar, which bookmark design should have the shortest bar, which gift bag prints should be taller than 17, and whether the Shakers bar should be taller than the Hand Drums bar.
This progression gives teachers several ways to use the set. The first page works well for guided practice, the missing-bar page can serve as a quick independent check, the repair page encourages careful comparison, and the story page adds a small amount of reading and reasoning. Because the scales increase from 5 to 10, 15, and 20 across the set, students also get practice reading different vertical ranges while the basic graph structure remains familiar.
Connect This Set with Other Grade 2 Data Activities
For students who are ready to read completed graphs and answer questions, pair this set with bar graph worksheets with picture data. To broaden data-representation practice beyond bars, use Grade 2 tally chart worksheets or scaled pictograph worksheets.
A Practical Grade 2 Graphing Sequence
These worksheets are especially useful when the goal is to move students from reading data to representing it accurately. Instead of repeating one identical format, the four pages require students to construct, complete, inspect, repair, and interpret bar graphs. That variety makes it easier to see whether a child truly understands how table values control bar height. Use one page at a time during a data unit, assign selected sections for independent practice, or keep the later pages for review after students have learned the basic parts of a bar graph.