
These line plot worksheets give second graders several ways to work with whole-number measurement data instead of asking them to repeat one graph-reading routine. Students begin with a small set of paper-strip lengths, build a line plot with X marks, compare completed plots with measurement lists, read line plots for different objects, and finish with short measurement stories. The four student pages keep the numbers in whole units while gradually shifting the thinking from counting marks to interpreting data in context.
Build line plots from whole-number measurements
The first worksheet starts with eight paper strips measuring 1, 1, 2, 2, 2, 3, 4, and 4 units. Students transfer those measurements to a blank line plot labeled from 1 to 4 units. This makes the connection between a raw data list and the X marks above each number visible: two marks belong above 1, three above 2, one above 3, and two above 4.
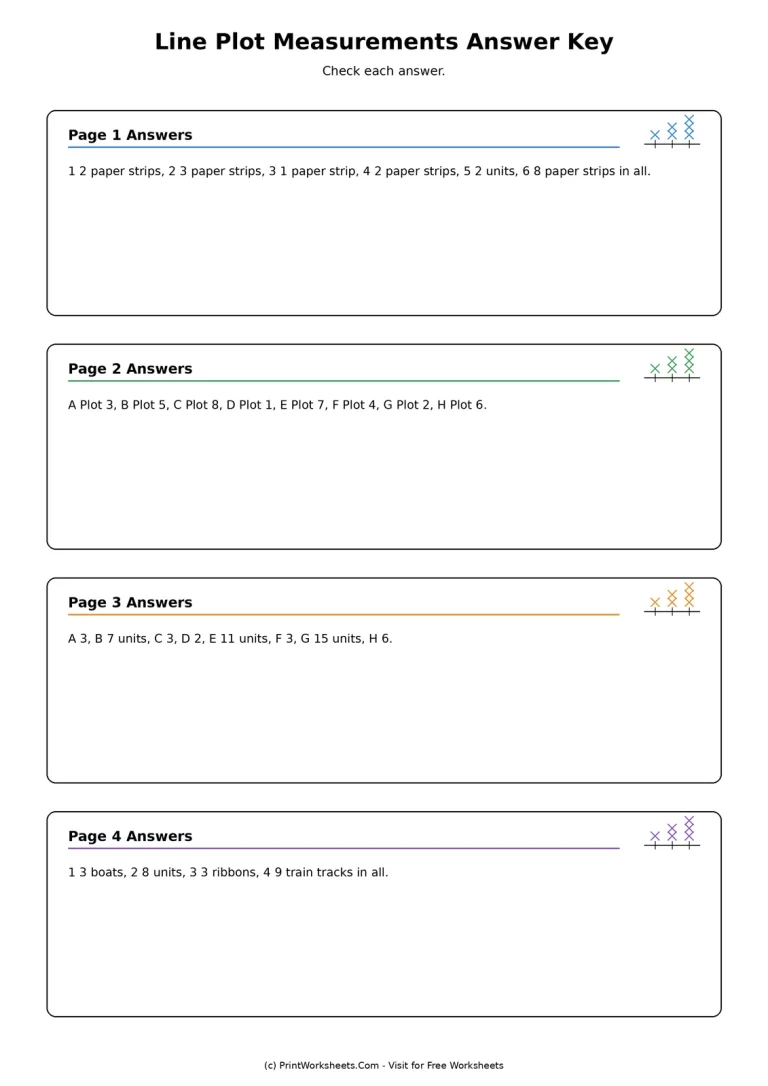
After constructing the graph, students answer six questions about the same data. They count how many strips are each length, identify 2 units as the length with the most strips, and determine that there are 8 strips in all. Because the questions come immediately after the plotting task, students can check their own understanding by comparing every answer with the graph they created.
Match measurement lists to completed line plots
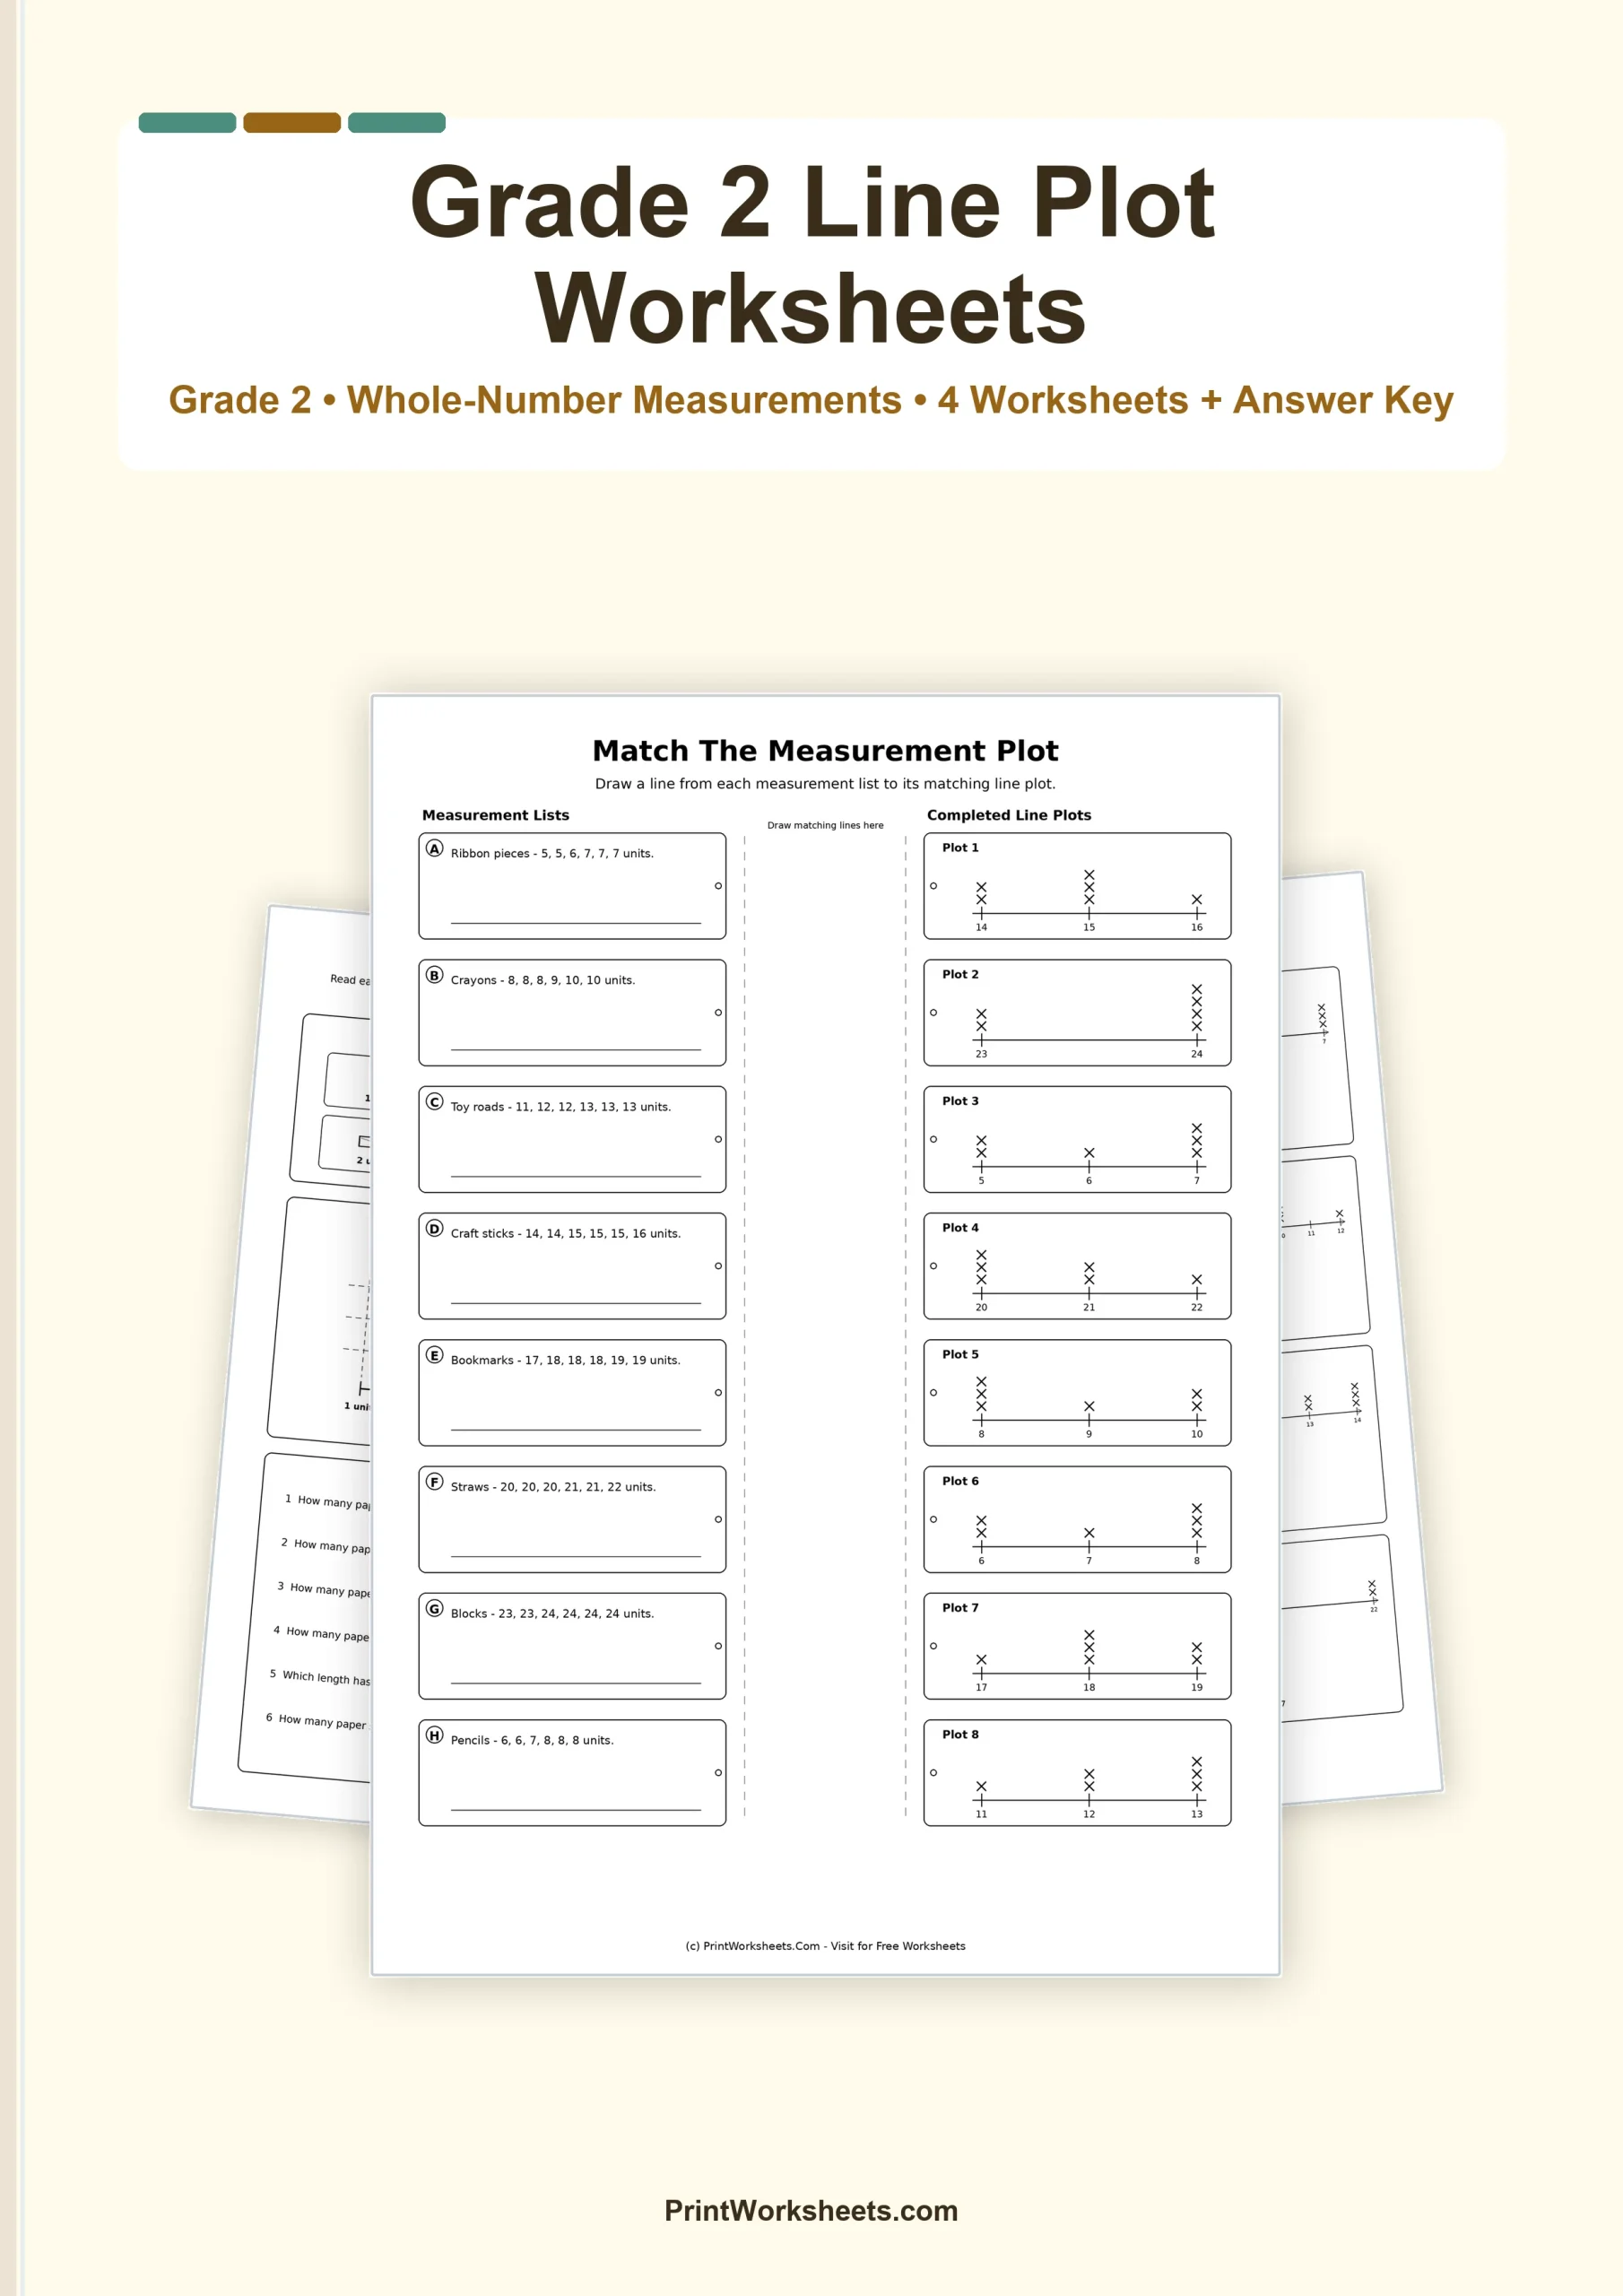
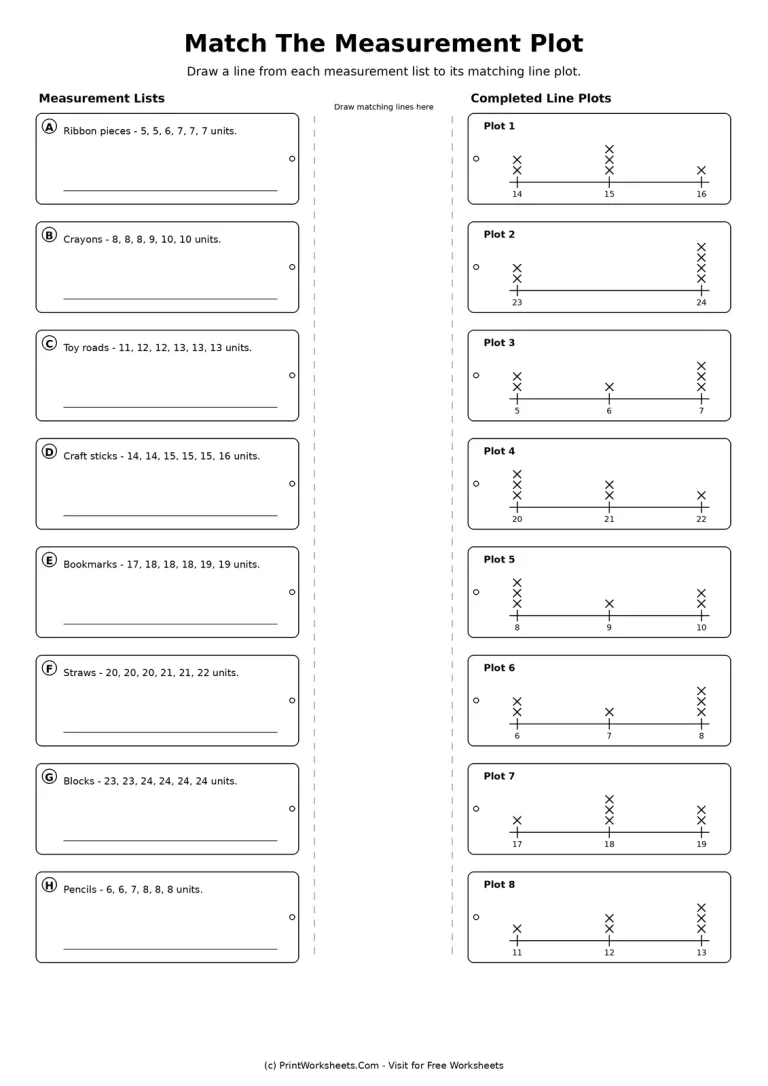
The second page changes the task. Eight measurement lists labeled A through H appear beside eight completed line plots. The lists include familiar classroom and craft objects such as ribbon pieces, crayons, toy roads, craft sticks, bookmarks, straws, blocks, and pencils. Students must compare the frequency of each number in a list with the number of X marks on a plot.
This matching format requires more than spotting a single value. For example, students may need to notice that one dataset has repeated measurements at 14 and 15 units with one measurement at 16, while another clusters values at 23 and 24 units. The measurement ranges extend from 5 through 24 units, giving children practice reading different scales while still using whole-number intervals.
Read and interpret Grade 2 line plots
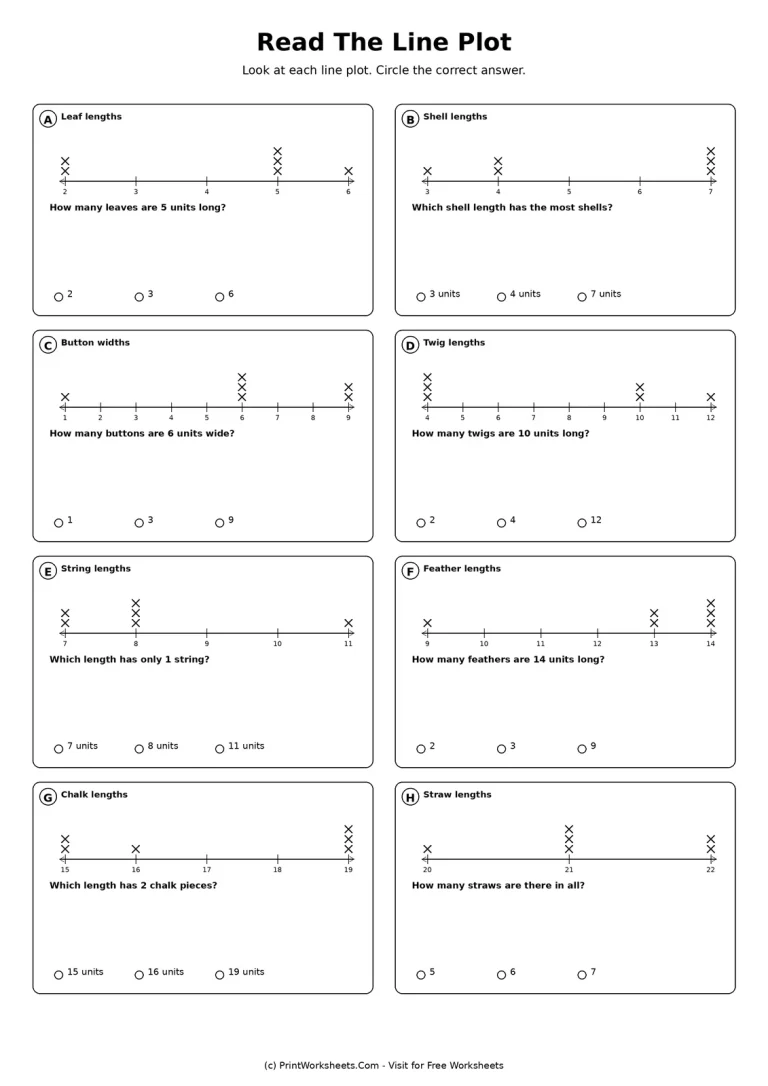
The third worksheet presents eight separate line plots for leaf lengths, shell lengths, button widths, twig lengths, string lengths, feather lengths, chalk lengths, and straw lengths. Each panel asks one focused multiple-choice question. Students identify an exact frequency, determine which length occurs most often, find a value represented only once, or count the total number of data points.
The questions encourage students to distinguish between a measurement value and its frequency. A mark at 7 units does not mean there are seven objects; students must count the X marks above 7. That distinction is central to reading line plots accurately and is reinforced across several different scales and contexts.
Apply line plots to measurement stories
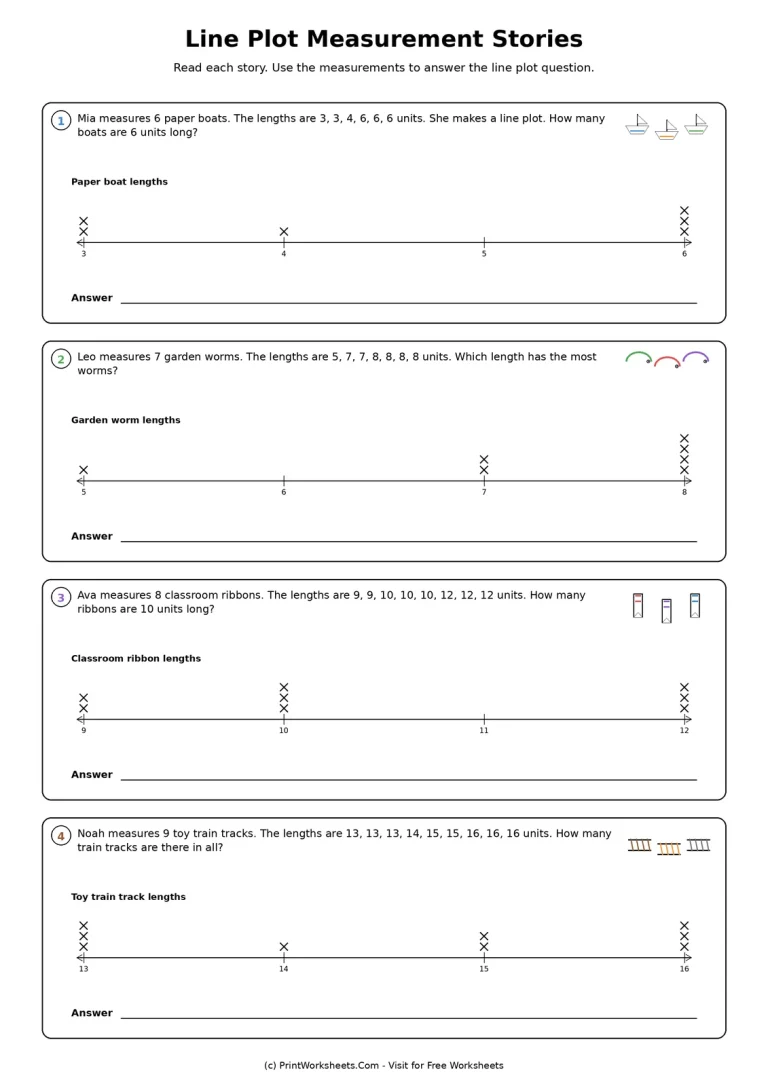
The fourth student page places the same graph-reading skills inside short stories. Mia measures six paper boats, Leo measures seven garden worms, Ava records eight classroom ribbons, and Noah measures nine toy train tracks. Each story supplies the measurement list and a matching completed line plot, followed by a written-response question.
Students answer questions such as how many boats are 6 units long, which worm length appears most often, how many ribbons measure 10 units, and how many train tracks were measured altogether. The stories keep the arithmetic light so the focus remains on extracting information from the line plot and connecting the graph back to the original measurement situation.
Ways to use these line plot worksheets
The pages can be used in sequence during a data and measurement unit or selected individually for targeted practice. Page 1 works well when introducing how repeated measurements become stacked X marks. Page 2 is useful for small-group reasoning because students must compare entire frequency patterns. Page 3 provides compact independent practice, while Page 4 works well as an application or review activity.
A complete teacher answer key is included for all four student worksheets, making the set practical for classwork, homework, tutoring, or home learning. For another Grade 2 graphing format, pair this set with the Grade 2 bar graph worksheets. Students ready for a later extension can also see how the same line-plot idea develops with fractional measurements in the Grade 4 fraction line plot worksheets.