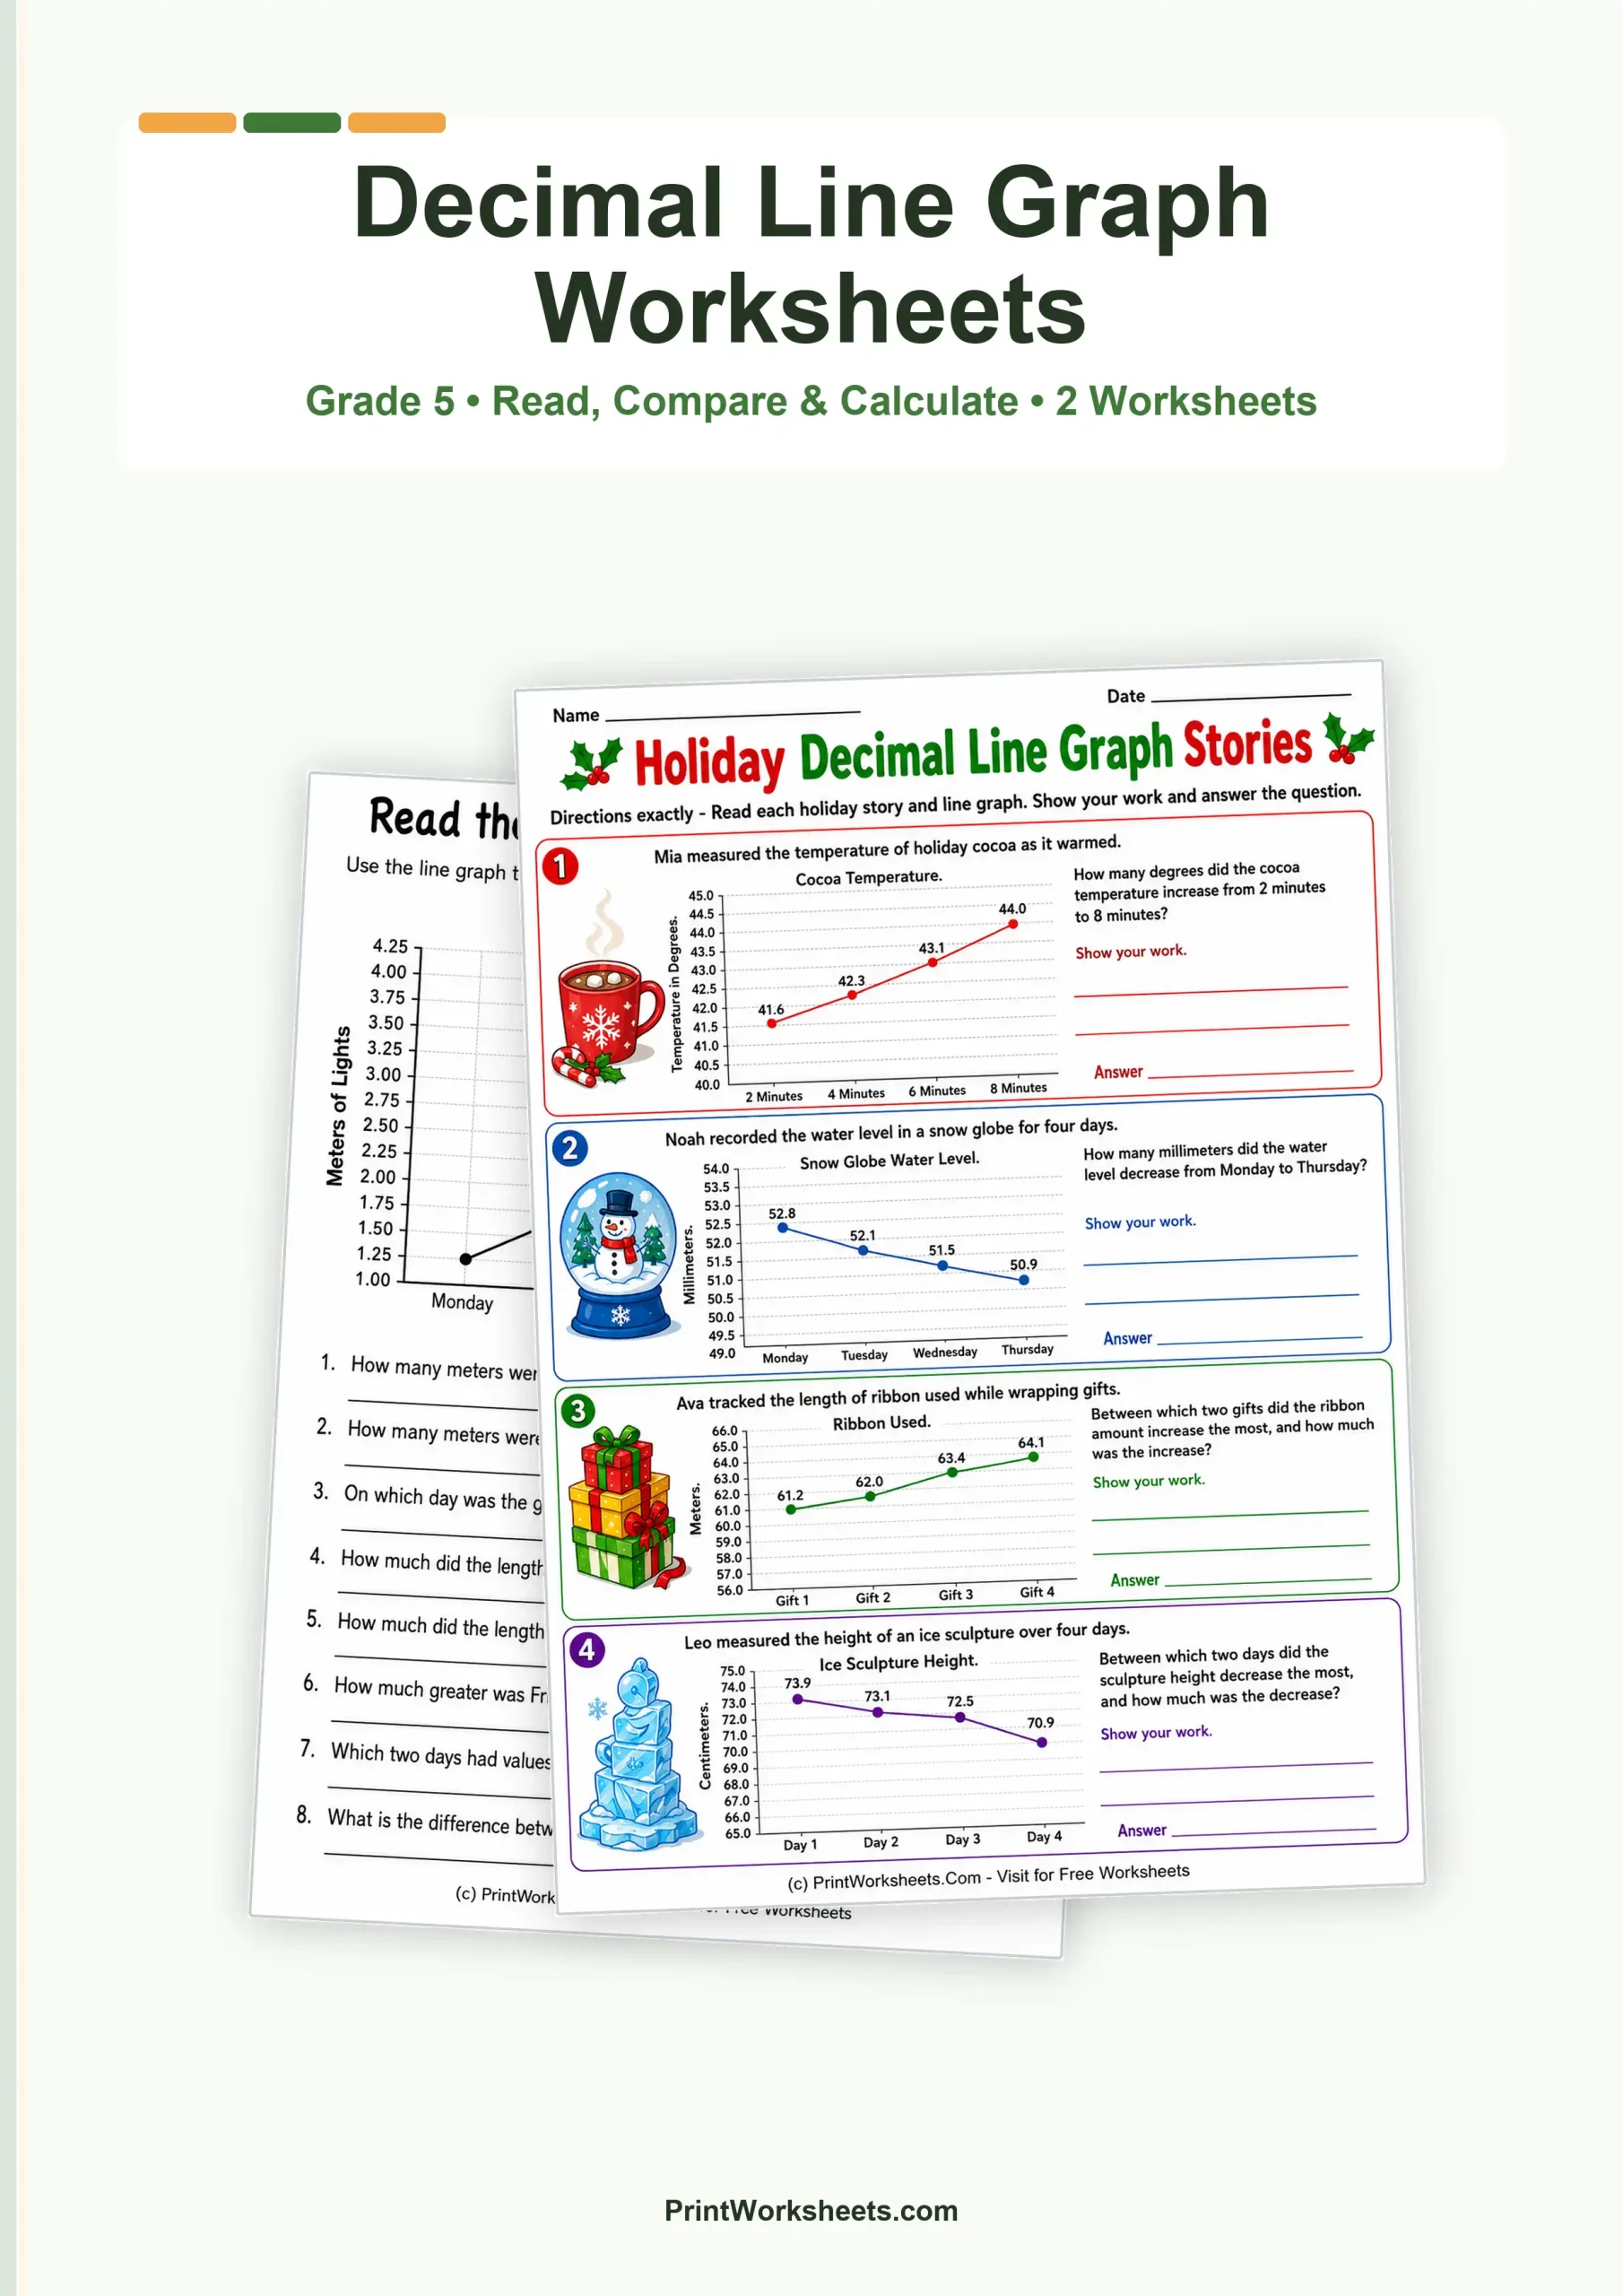
A point at 3.25 on a line graph asks students to do more than simply find a dot. They must read the scale accurately, connect the point to its category, and use decimal reasoning when the question asks for a difference or change. These decimal line graph worksheets give Grade 5 students focused practice with those skills through one detailed daily-data graph and a set of short holiday-themed graph stories.
What These Decimal Line Graph Worksheets Practice
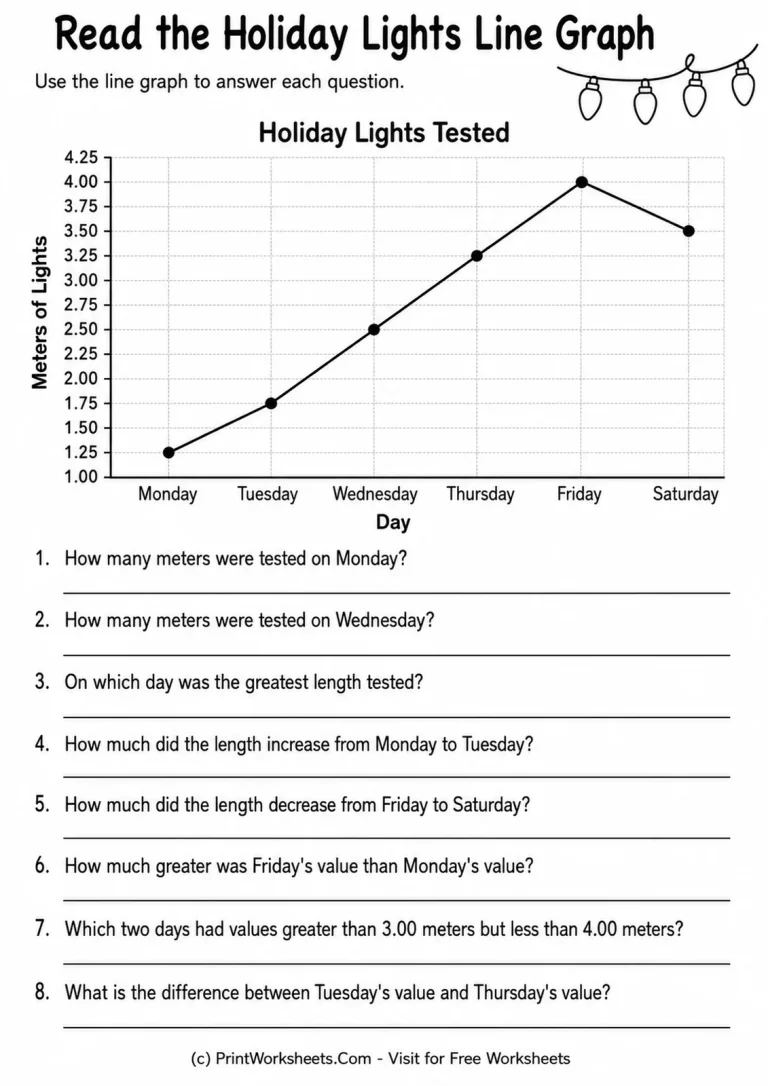
The first worksheet centers on a line graph titled Holiday Lights Tested. Data are shown from Monday through Saturday, with values ranging from 1.25 meters to 4.00 meters. Students answer eight questions that move beyond basic point reading. They identify exact values for specific days, determine the day with the greatest measurement, calculate how much the value increased from one day to the next, calculate a decrease, compare Friday with Monday, identify values that fall inside a given range, and find the difference between two nonconsecutive days.
This combination is useful because students must keep the graph scale and the question language in mind at the same time. A prompt asking for a value requires direct reading, while a prompt asking how much greater one value is than another requires subtraction after both points have been interpreted correctly. The worksheet therefore connects graph literacy with practical decimal computation.
Reading Exact Decimal Values from a Graph
The daily holiday-lights graph includes values such as 1.25, 1.75, 2.50, 3.25, 4.00, and 3.50 meters. Because the points do not all land on whole numbers, students need to pay attention to the labeled intervals instead of estimating from the general height of each point. Questions about Monday, Wednesday, Friday, and Saturday encourage careful use of both axes.
Students who need additional support with the place-value meaning behind numbers like 3.25 or 4.00 can also benefit from decimal place value to thousandths worksheets for Grade 5 before returning to graph interpretation.
From Graph Reading to Decimal Word Problems
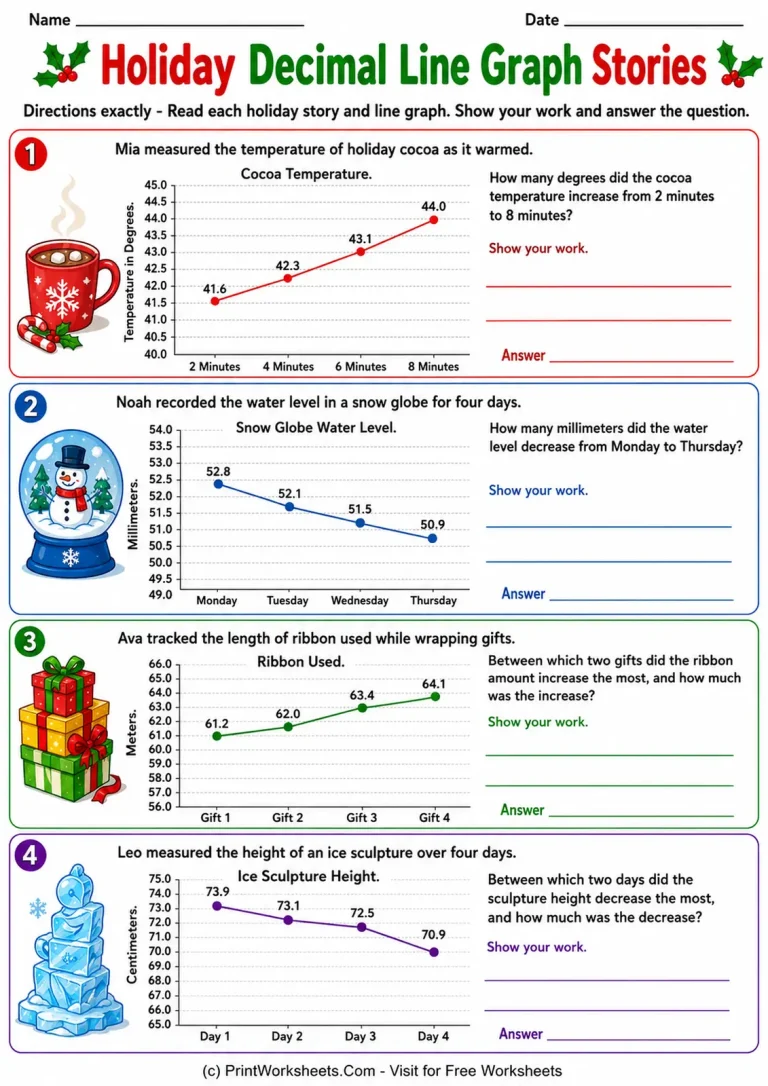
The second worksheet changes the format from one large graph to four compact story problems. Each problem provides a line graph with decimal measurements and asks students to calculate a change across time or between consecutive data points. The visual contexts include cocoa warming over time, the water level in a snow globe across four days, ribbon used while wrapping gifts, and the changing height of an ice sculpture.
Four Real-World Measurement Contexts
The cocoa graph uses temperature values of 41.6, 42.3, 43.1, and 44.0 degrees. Students compare the first and last plotted values to determine the total increase. The snow-globe graph moves downward from 52.8 millimeters on Monday to 50.9 millimeters on Thursday, so students must interpret a decreasing trend and calculate the total change.
The ribbon graph asks students to compare consecutive increases among 61.2, 62.0, 63.4, and 64.1 meters. Instead of being told which two points to subtract, they first have to determine where the greatest increase occurs. The ice-sculpture graph uses a similar reasoning structure with decreasing measurements of 73.9, 73.1, 72.5, and 70.9 centimeters. Together, these problems help students distinguish between simply finding an endpoint difference and analyzing several intervals to locate the largest change.
Each story problem also provides space for students to show their work before recording an answer. That makes the worksheet useful for checking whether a student selected the correct graph values and used the correct subtraction, not just whether the final number is correct. For learners ready to extend this calculation work into longer contexts, multi-step decimal word problems worksheets for Grade 5 provide a natural next step.
Ways to Use the Worksheets in Grade 5
These worksheets can be used after students have learned how the horizontal and vertical axes organize data and are comfortable comparing decimals to the hundredths place. The large holiday-lights graph works well for independent practice because several question types are built around one consistent data set. Teachers can also ask students to explain which two graph points they used before allowing them to calculate a difference.
The four-story worksheet is especially helpful for a follow-up lesson, small-group practice, or a short assessment of graph interpretation with decimal computation. Students encounter increasing and decreasing trends, several measurement units, and questions that require both reading and reasoning. The holiday visuals add variety without changing the mathematical focus.
Used together, the two activities give Grade 5 learners a compact progression from exact decimal graph reading to interpreting change in short real-world situations. The goal is not merely to recognize whether a line rises or falls, but to read the actual values, compare them accurately, and justify how much the data changed.