These circle graph worksheets give Grade 5 students several ways to understand how parts of a whole can be shown with sectors, fractions, and percentages. Instead of repeating one type of pie-chart question, the set moves from straightforward graph reading to fraction models, missing-percent calculations, and real-world problems that connect percentages to actual quantities. The four student pages work well as a short introduction, guided practice sequence, homework set, or review before more advanced data analysis.
Circle graph worksheets for reading percent sectors
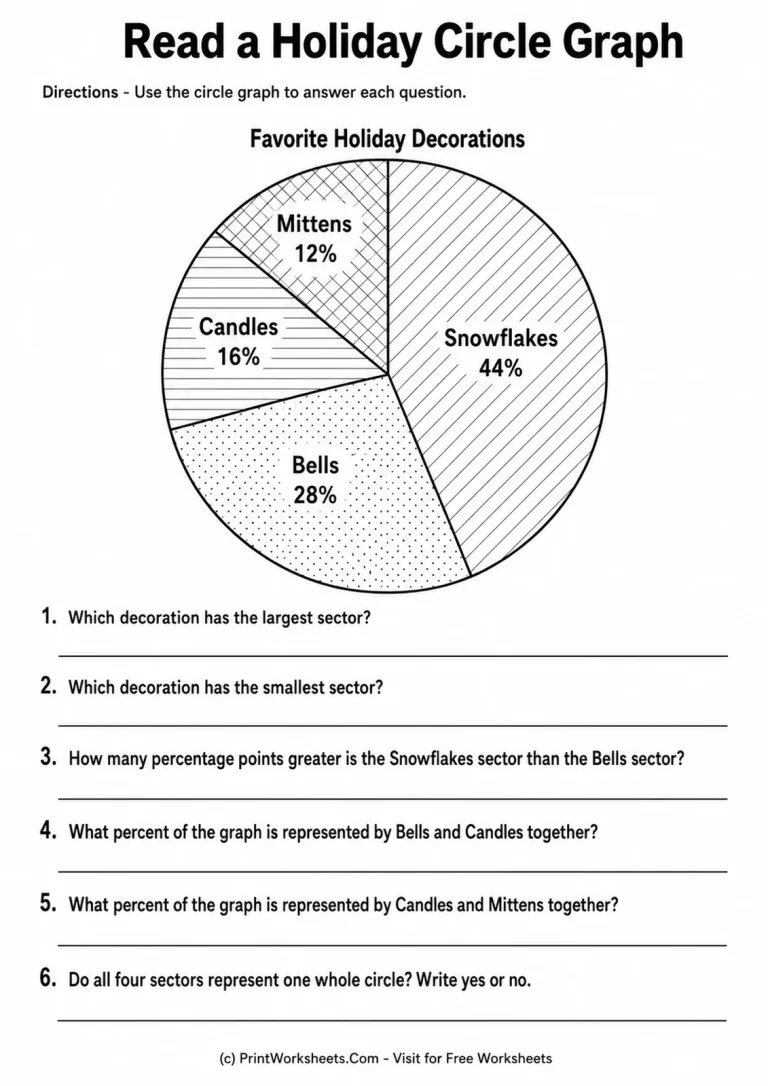
The first activity begins with a holiday-themed circle graph titled “Favorite Holiday Decorations.” Four categories divide the whole graph: Snowflakes at 44%, Bells at 28%, Candles at 16%, and Mittens at 12%. Students identify the largest and smallest sectors, compare Snowflakes and Bells using percentage points, and combine categories to find totals such as Bells plus Candles or Candles plus Mittens.
This page also reinforces an essential circle-graph idea: all sectors together represent one whole. Because 44 + 28 + 16 + 12 equals 100, students can confirm that the graph is complete. That simple check is useful preparation for later work where a sector value is missing and students must reason backward from 100%.
Connecting fractions to circle sectors
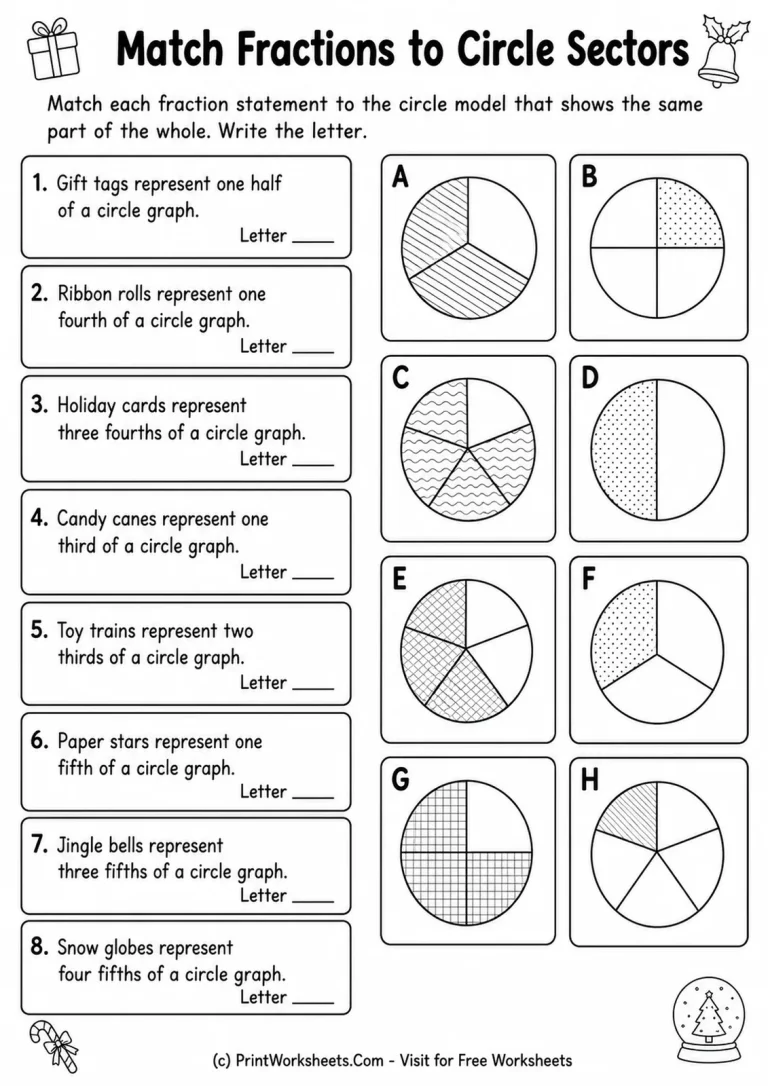
The second worksheet changes representations. Students match fraction statements to eight lettered circle models. The fractions include one half, one fourth, three fourths, one third, two thirds, one fifth, three fifths, and four fifths. Each model uses equal sectors and patterned shading so students must focus on how much of the whole is represented rather than on color.
This matching format helps students connect familiar fraction language to the visual structure of a circle graph. For example, they must recognize that a circle split into two equal parts with one part shaded represents one half, while a circle divided into five equal parts with four shaded represents four fifths. The page is especially useful for students who understand fractions numerically but still need practice interpreting fractional parts in diagrams.
Finding the missing percent of a whole
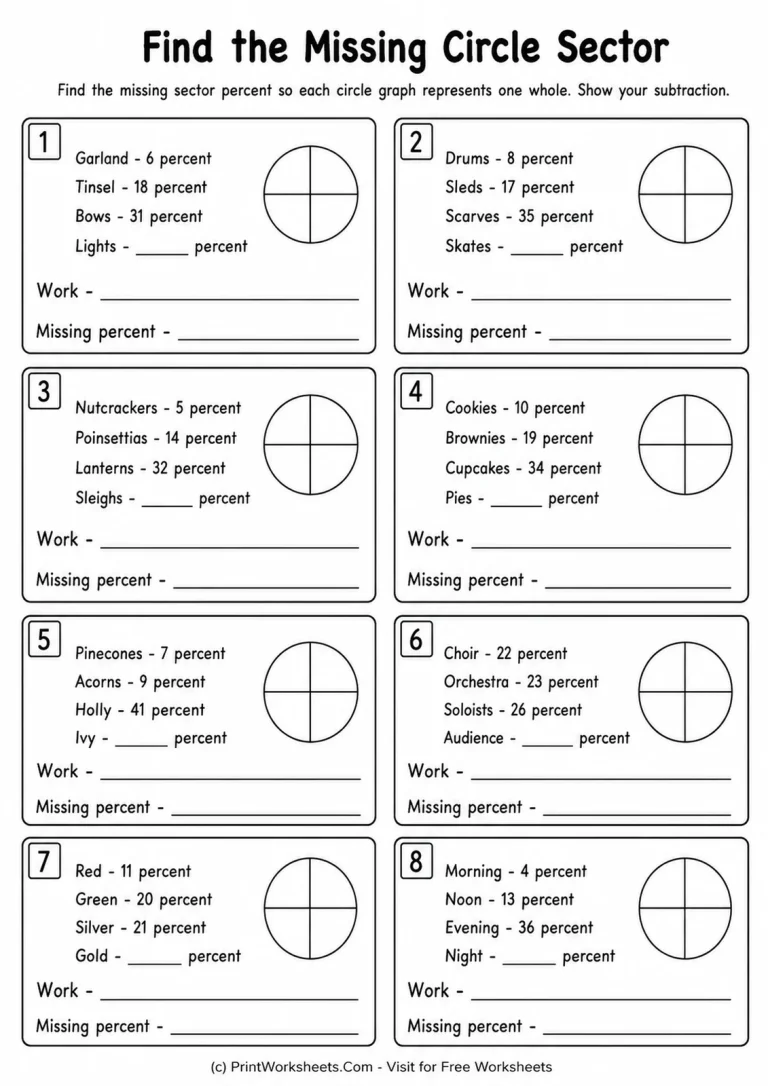
The third page shifts from reading a completed display to constructing the missing information. Eight problems give three category percentages and ask students to calculate the fourth percentage so that the circle graph totals 100%. The numbers vary across the page, with missing values including 45%, 40%, 49%, 37%, 43%, 29%, 48%, and 47%.
Students are asked to show their subtraction, encouraging a reliable process: add the known percentages, then subtract that sum from 100. For example, if the known sectors are 6%, 18%, and 31%, their total is 55%, leaving 45% for the final sector. This structure develops both percentage fluency and the understanding that a complete circle graph always represents the entire data set.
Applying circle graph percentages to real quantities
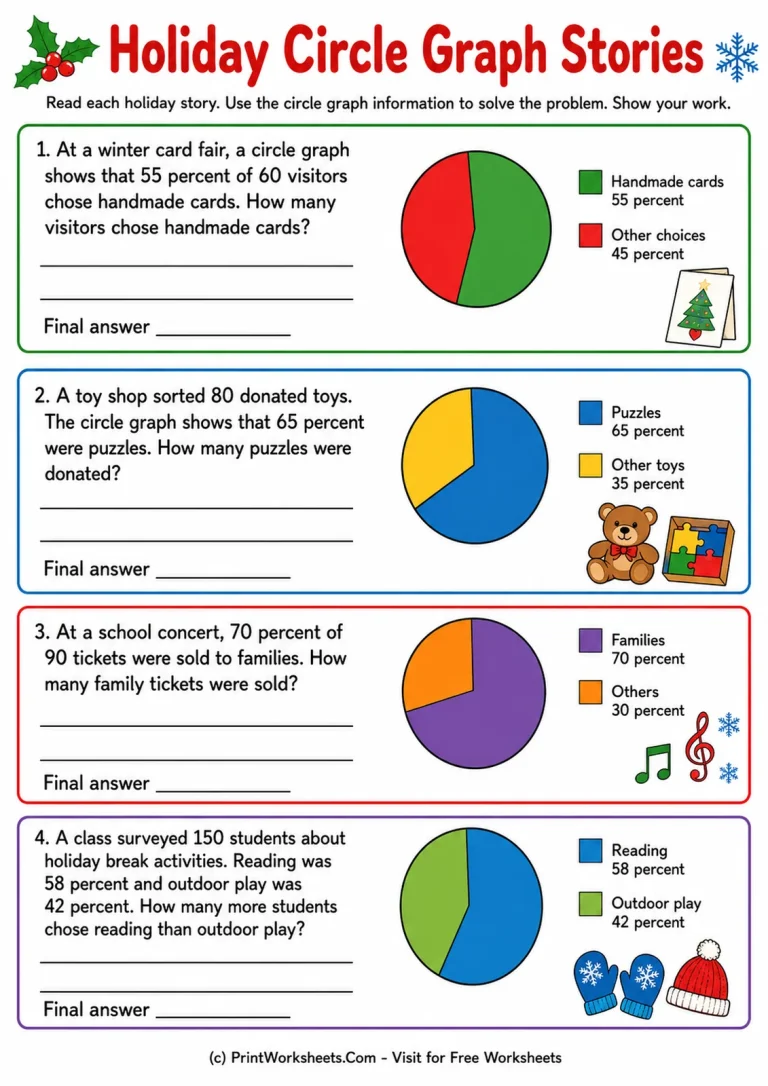
The fourth worksheet places the skill into short holiday stories. Students use percentages to calculate actual counts, not just sector sizes. One problem asks for 55% of 60 visitors, another asks for 65% of 80 donated toys, and another finds 70% of 90 concert tickets. These produce whole-number answers that allow students to concentrate on the percent reasoning itself.
The final story adds a comparison step. In a survey of 150 students, reading represents 58% and outdoor play represents 42%. Students determine how many more students chose reading by finding the 16-percentage-point difference and applying it to 150, giving a difference of 24 students. This makes the last problem more demanding than the earlier one-step percentage questions and gives the set a useful progression in difficulty.
Ways to use this Grade 5 circle graph practice
The pages can be assigned in order for a compact mini-unit: first interpret labeled sectors, then connect sectors to fractions, next complete a missing portion of 100%, and finally apply percentages to real-world quantities. Teachers can also choose individual pages for targeted practice. The reading page works well for graph interpretation, the fraction page supports visual fraction review, the missing-sector page strengthens percent subtraction, and the story page provides application practice.
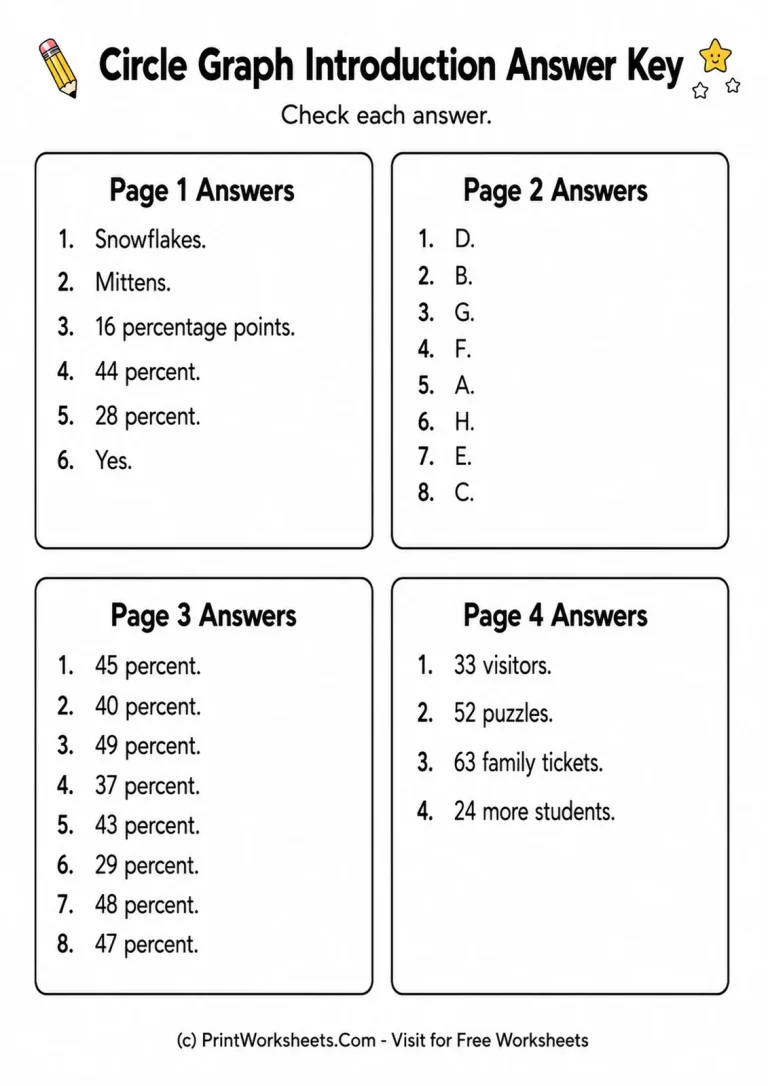
A complete answer key is included for all four student activities, making the set practical for classroom centers, independent work, take-home practice, or quick review. By the end of the sequence, students have worked with the same central idea in several forms: every circle graph represents one whole, and each sector can be described and compared using fractions, percentages, and quantities.