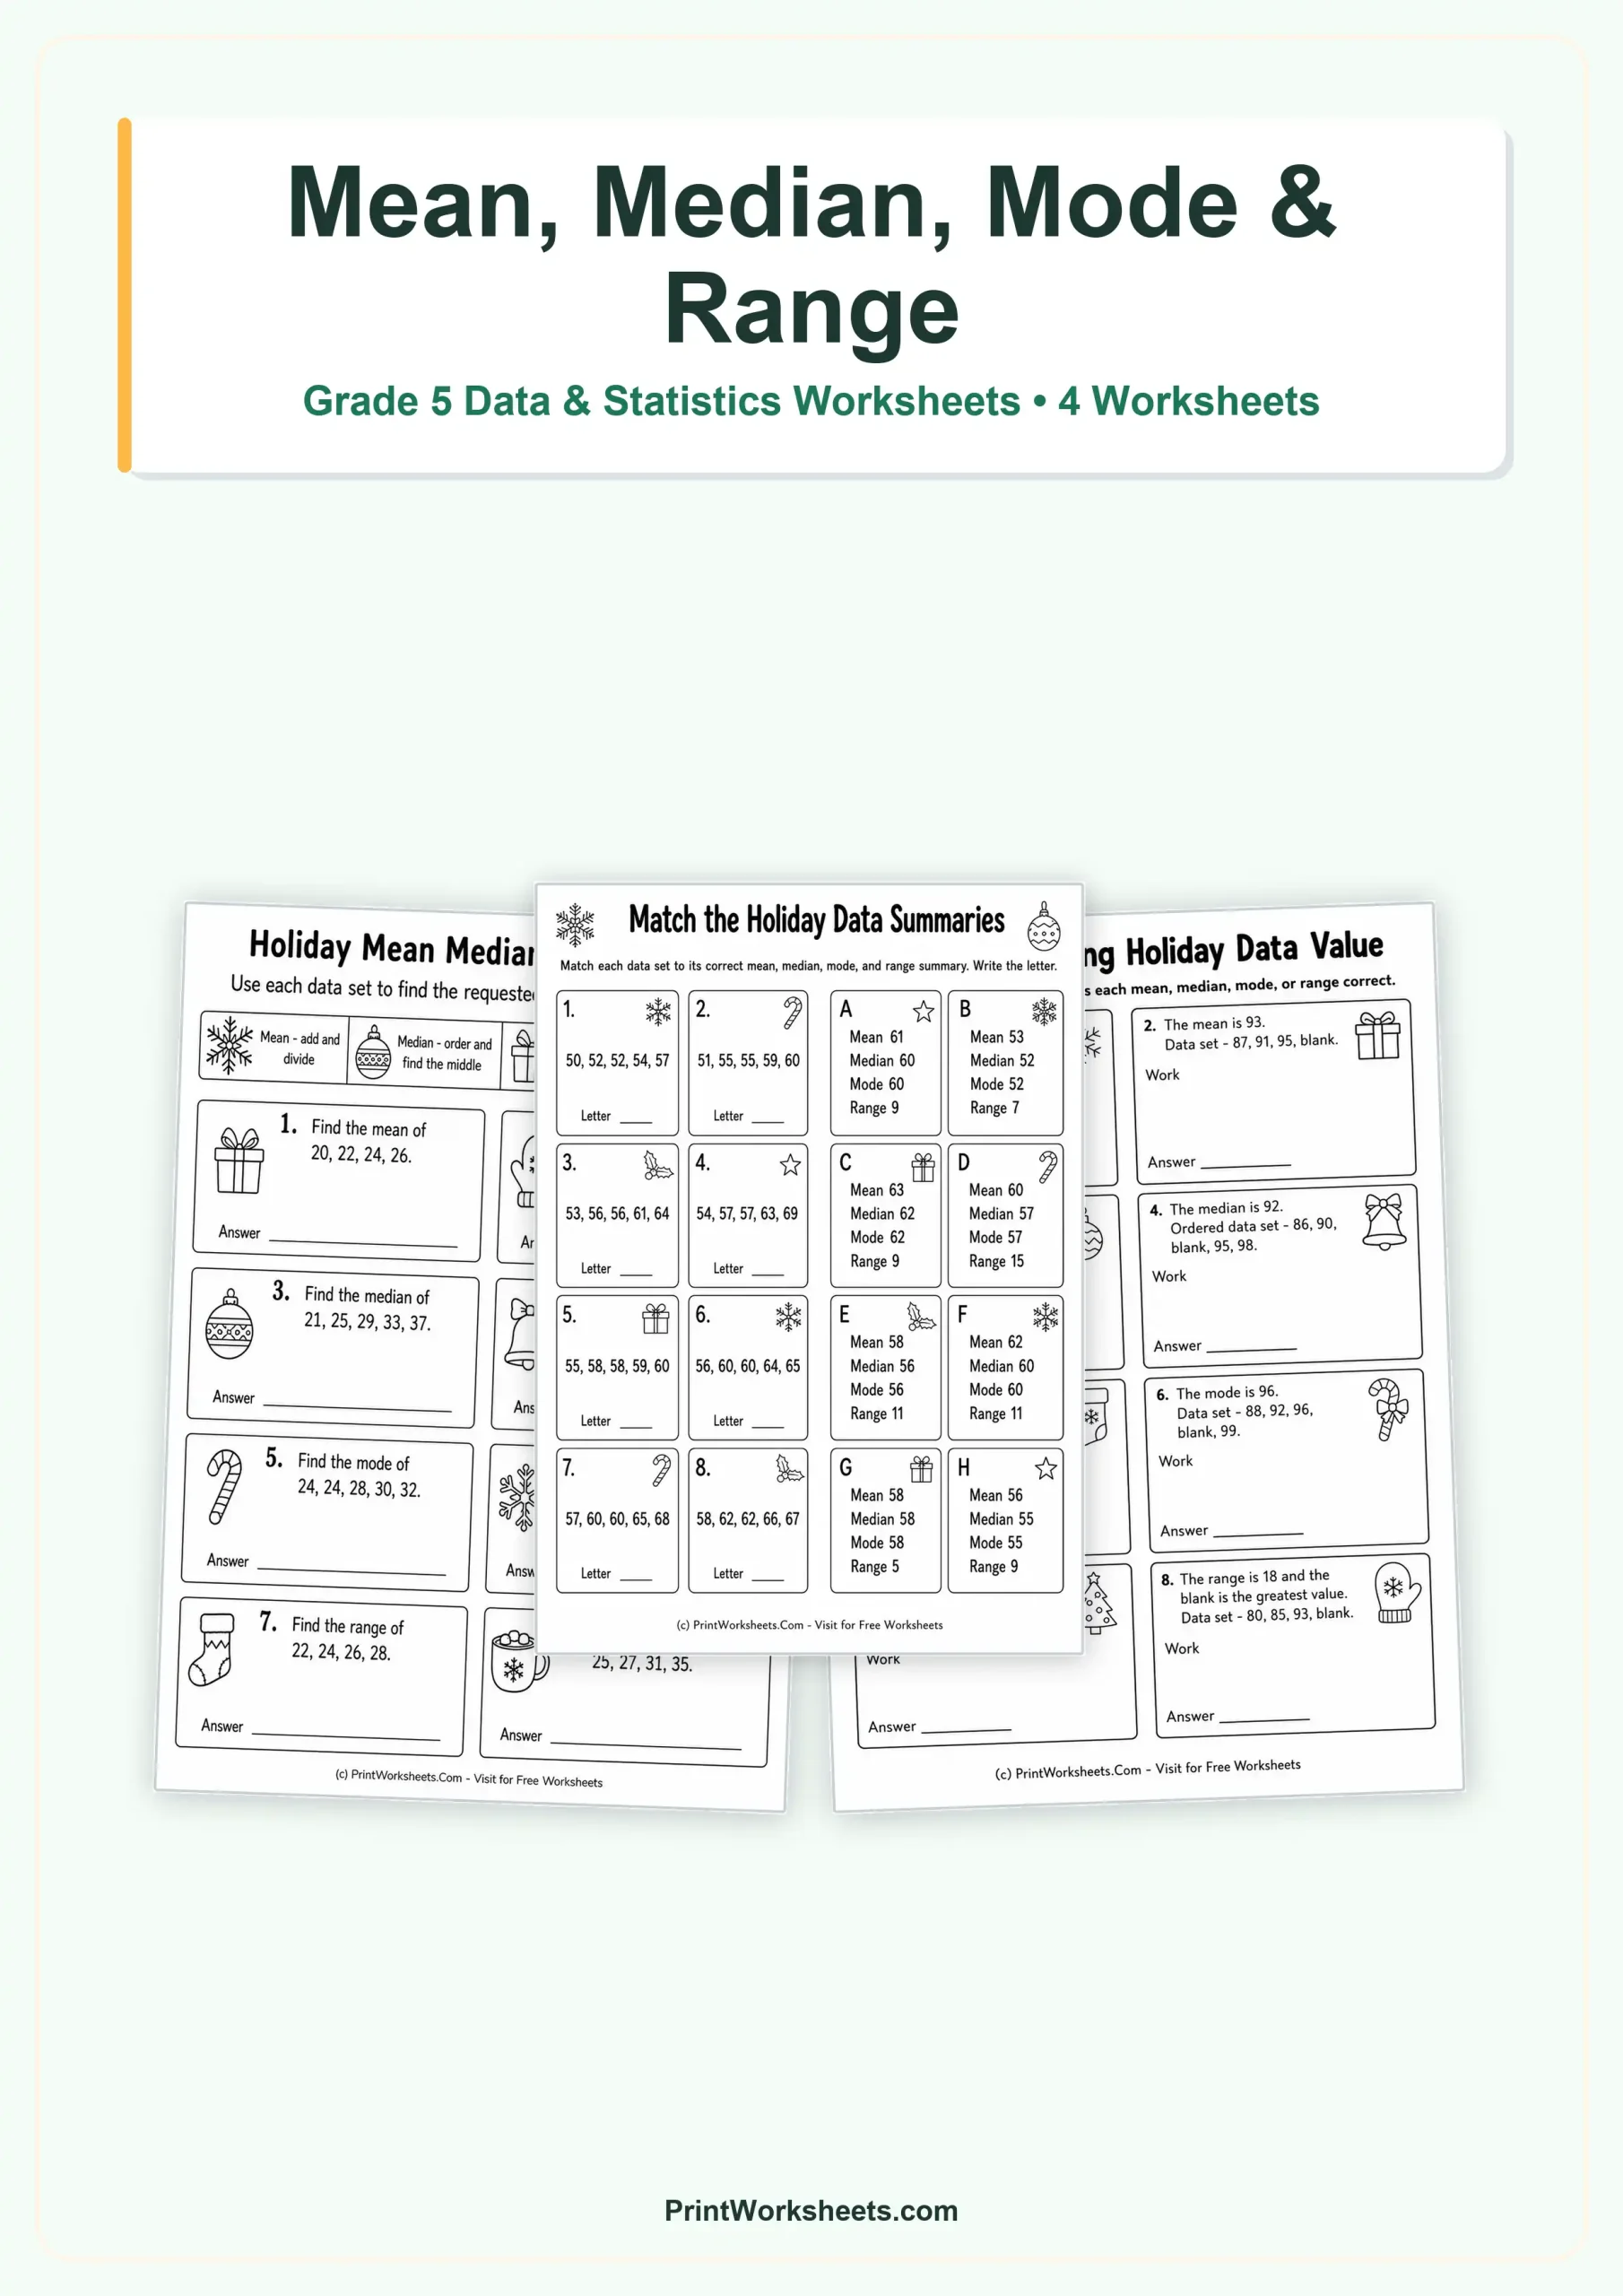
These mean median mode and range worksheets give Grade 5 students four different ways to work with whole-number data sets. Instead of repeating one calculation format, the printable set moves from finding individual measures to checking complete statistical summaries, solving for missing values, and applying each measure in short holiday-themed data stories. The numbers stay manageable enough for students to focus on reasoning while still requiring careful ordering, addition, division, comparison, and interpretation.
Mean Median Mode and Range Worksheets for Grade 5
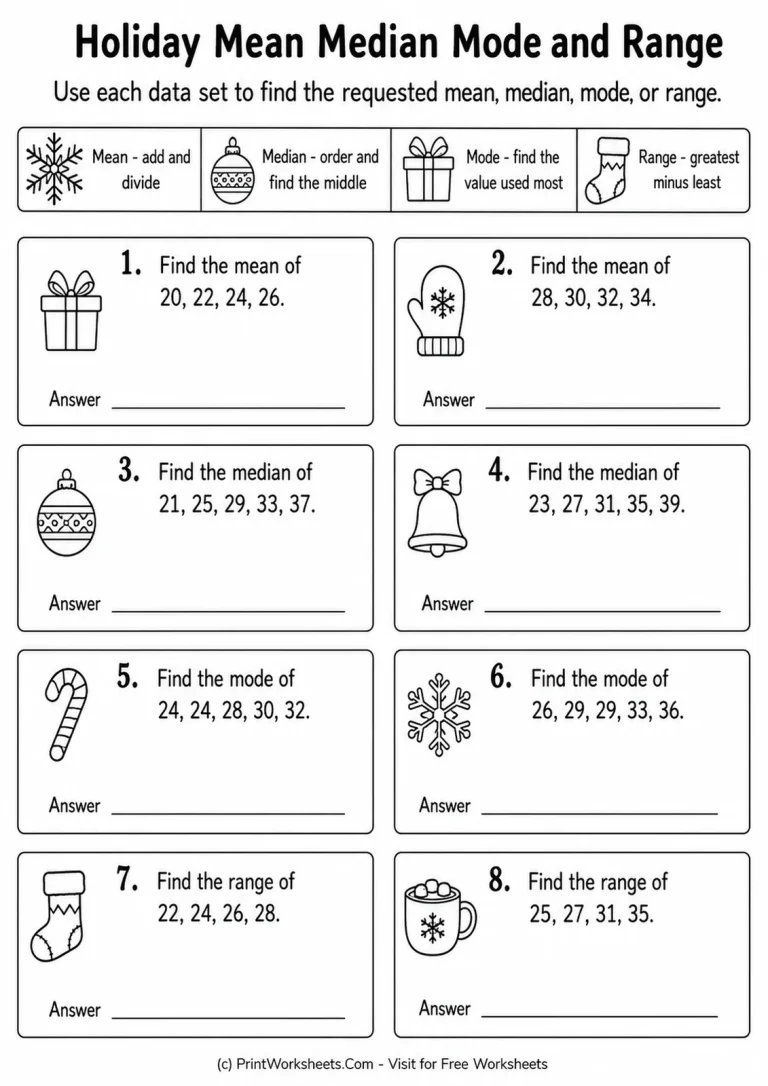
The first worksheet works well as a focused review or starting activity. A four-part reference strip reminds students what mean, median, mode, and range represent before they solve eight direct computation questions. Students must decide which procedure fits each problem: add and divide for the mean, order values for the median, identify the most frequent value for the mode, or subtract the least value from the greatest value for the range. Because all four measures appear on one page, teachers can quickly see whether a student understands the differences between them rather than relying on one memorized routine.
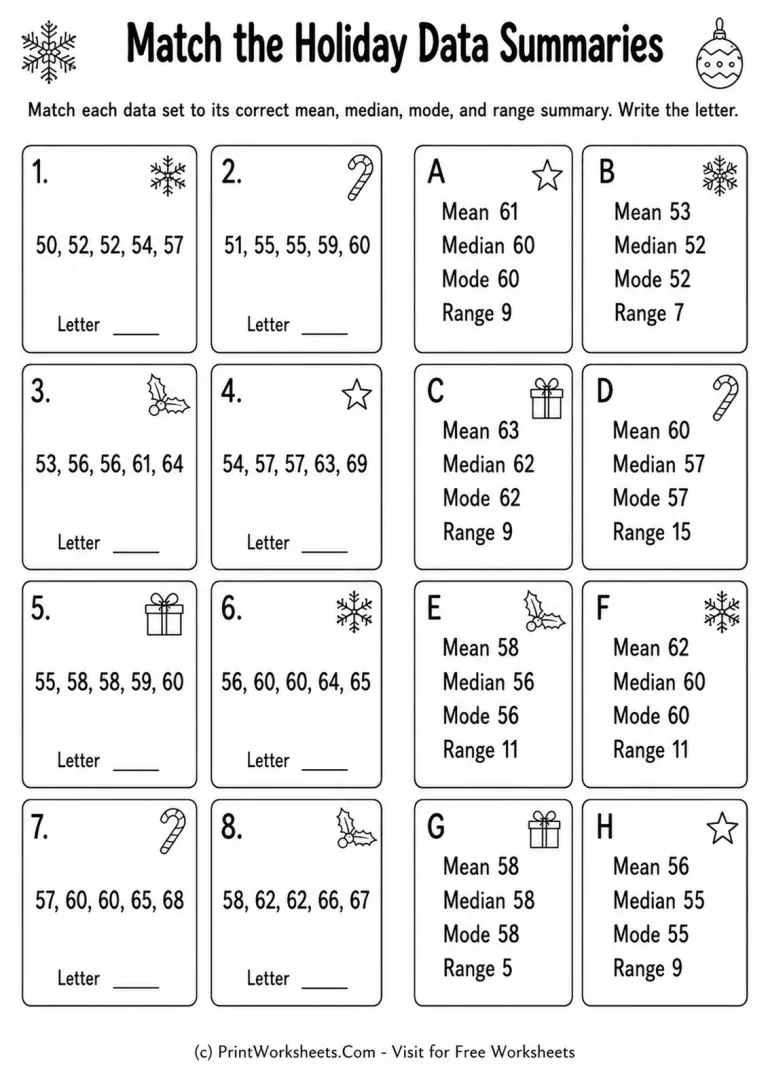
The second page increases the amount of checking required. Students receive eight five-number data sets and eight summary cards labeled A through H. Each summary gives a mean, median, mode, and range, so a match is not based on a single clue. Students need to calculate or verify several statistics and decide which complete summary belongs to each data set. This format encourages accuracy because an error in sorting, division, or range calculation can make an otherwise tempting card incorrect.
Build Statistical Reasoning Beyond Basic Computation
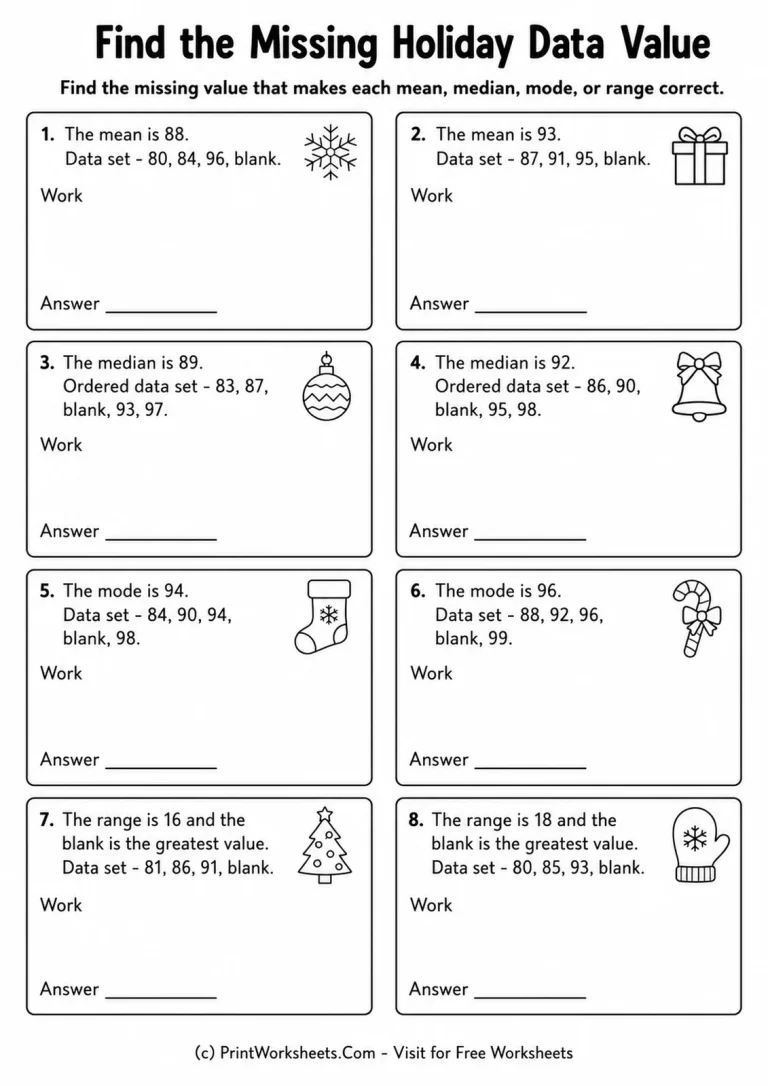
The third worksheet changes the direction of the thinking. Rather than giving every number and asking for a statistic, it asks students to determine a missing value that makes a stated mean, median, mode, or range true. There are two problems for each of the four measures. Mean questions require students to reason about a required total, while median problems make the position of values important. Mode questions focus attention on frequency, and range questions require students to consider the relationship between the smallest and largest values. This makes the page especially useful after students can already calculate the four measures independently.
For students who also need practice interpreting visual data displays, the scaled bar graph worksheets provide another way to read and compare numerical information. The scaled pictographs worksheets can also reinforce careful data reading before students summarize a collection of numbers statistically.
Apply Mean, Median, Mode, and Range in Short Data Stories
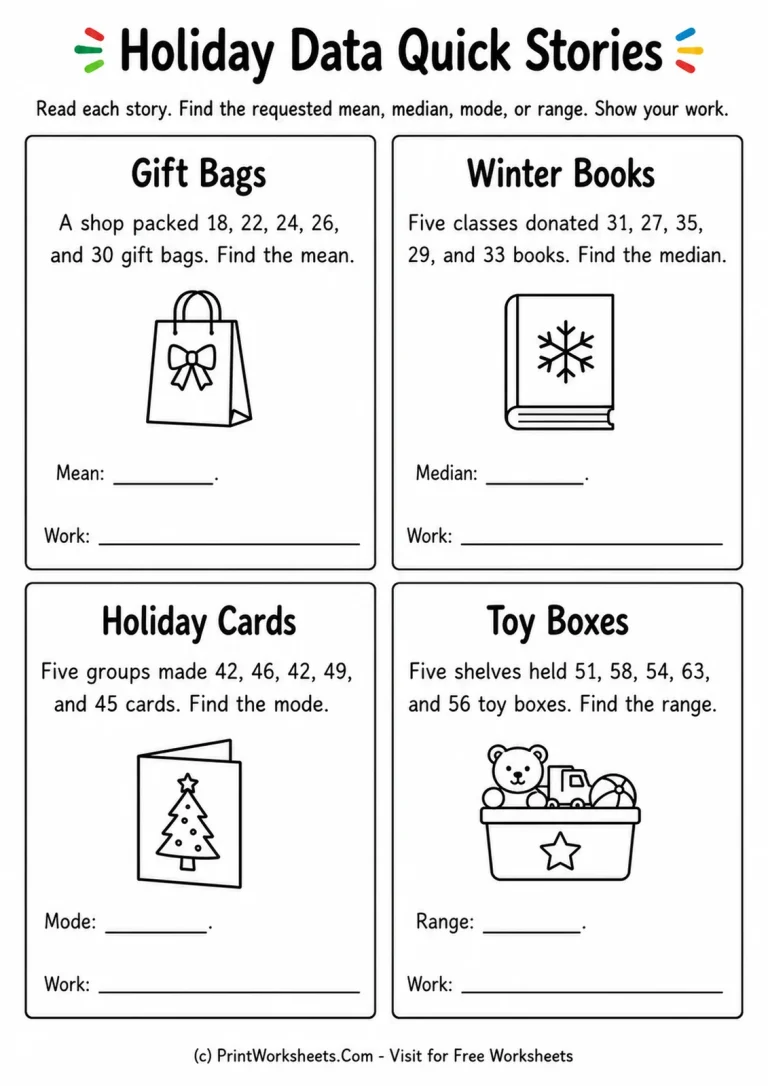
The fourth printable places each measure inside a brief real-world-style context. Four story cards use data about Gift Bags, Winter Books, Holiday Cards, and Toy Boxes. One problem targets each major measure, giving students practice deciding what the question is asking before they calculate. This is a useful bridge between isolated arithmetic and word-problem reasoning because students must identify the relevant statistic from the wording, organize the supplied values, and show their work.
The four-page progression makes the set flexible for different classroom needs. Page one can serve as guided practice or a warm-up after instruction. Page two works well for partner checking, math centers, or independent practice because students must compare complete sets of statistical information. Page three is a stronger challenge for students ready for inverse reasoning, while page four can be used as a short application task or informal assessment.
Ways to Use These Grade 5 Data Worksheets
Teachers can assign the pages in order when introducing or reviewing the topic, but each activity can also stand alone. For homework, students might complete the direct calculation page before attempting the missing-value problems in class. During small-group instruction, the matching activity can prompt students to explain why one summary fits a data set and another does not. The story problems are useful for checking whether students can recognize which measure is appropriate without being told a calculation procedure.
Parents can use the printables for additional practice by asking students to explain their steps aloud. A strong explanation should include why the data must be ordered for the median, how the mean depends on both the total and the number of values, why the mode is based on frequency, and how the range describes the distance between the extremes. With computation, comparison, reverse reasoning, and context all included, this Grade 5 set offers a compact path from basic statistics practice to more thoughtful data analysis.