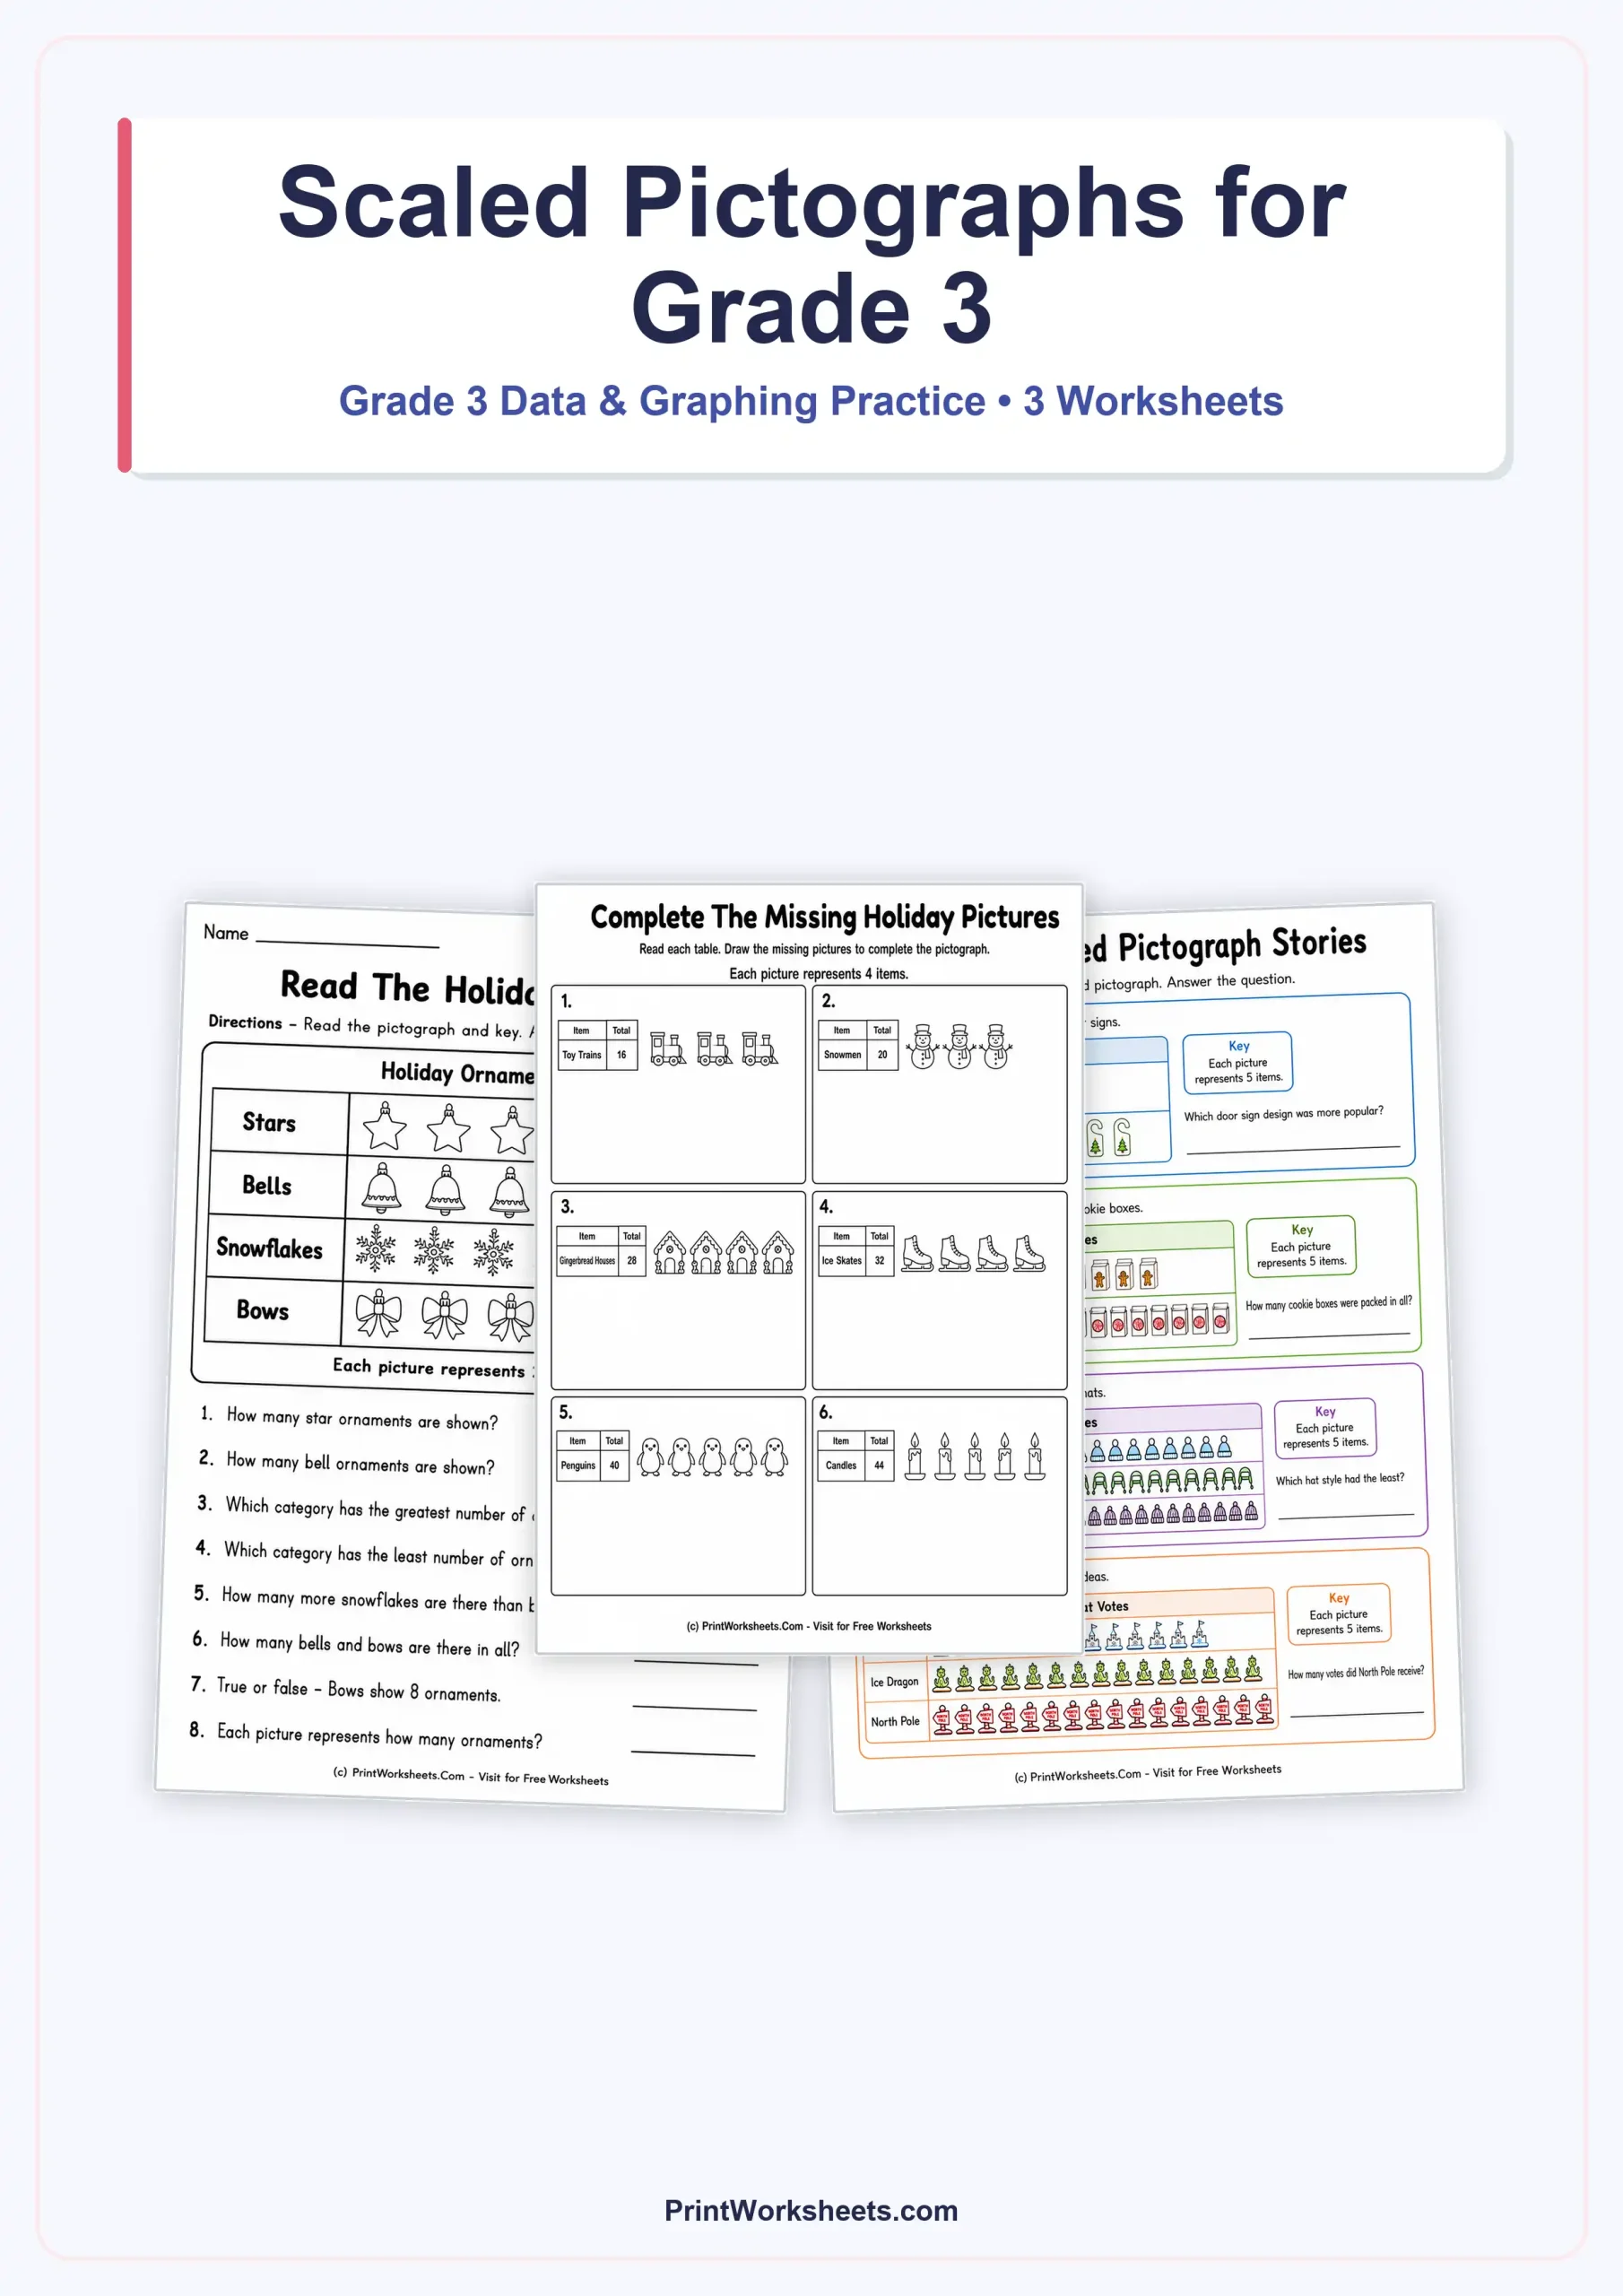
These scaled pictographs for Grade 3 give students three different ways to work with picture-based data instead of repeating one worksheet format. The set begins with a holiday ornament pictograph where each symbol represents 2 ornaments, moves into a completion activity where each picture represents 4 items, and then finishes with short story problems using a scale of 5. That progression makes the worksheets useful for students who are ready to move beyond simply counting pictures and start using multiplication, addition, subtraction, and comparison to interpret data.
What students practice with scaled pictographs for Grade 3
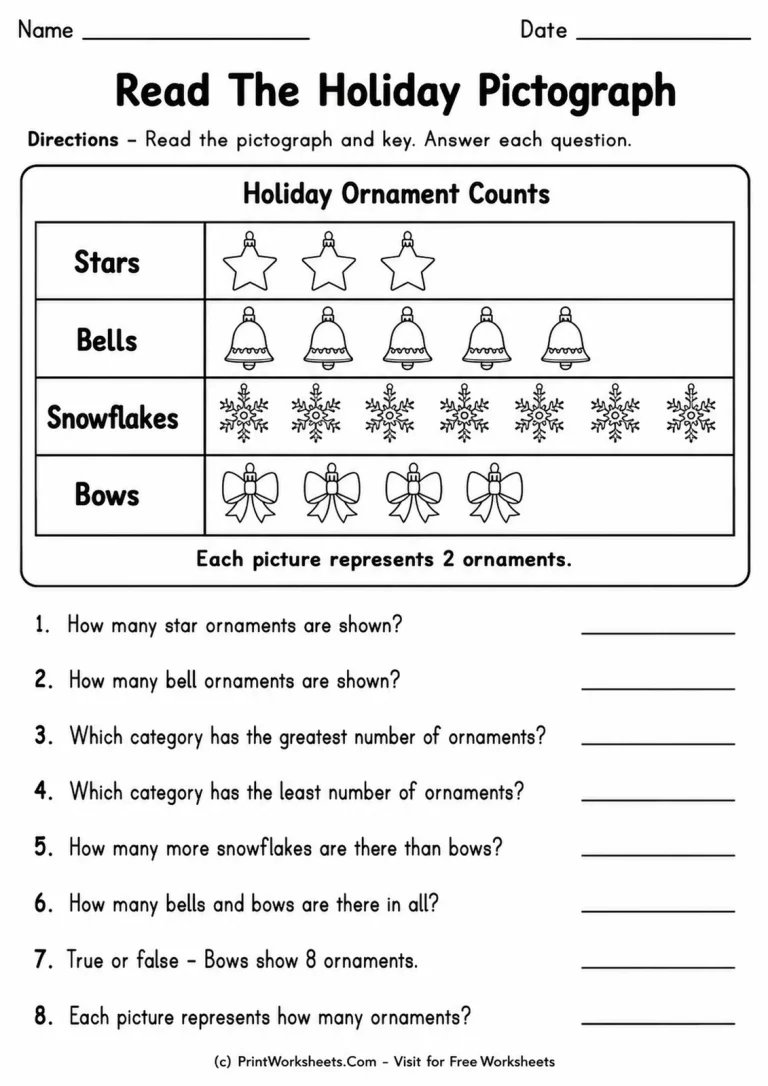
The first worksheet focuses on reading a pictograph carefully before answering questions. Students study four ornament categories: stars, bells, snowflakes, and bows. Because each picture represents 2 ornaments, they must connect the number of symbols to the actual quantity shown. The eight questions ask for direct totals, the category with the greatest amount, the category with the least amount, the difference between snowflakes and bows, a combined total for bells and bows, a true-or-false statement, and the value represented by one picture.
This mix is helpful because it checks whether students understand the key rather than just count icons. For example, three star pictures represent 6 ornaments, while seven snowflake pictures represent 14. Students therefore need to use the scale consistently before comparing categories or finding differences.
Complete a pictograph from a target total
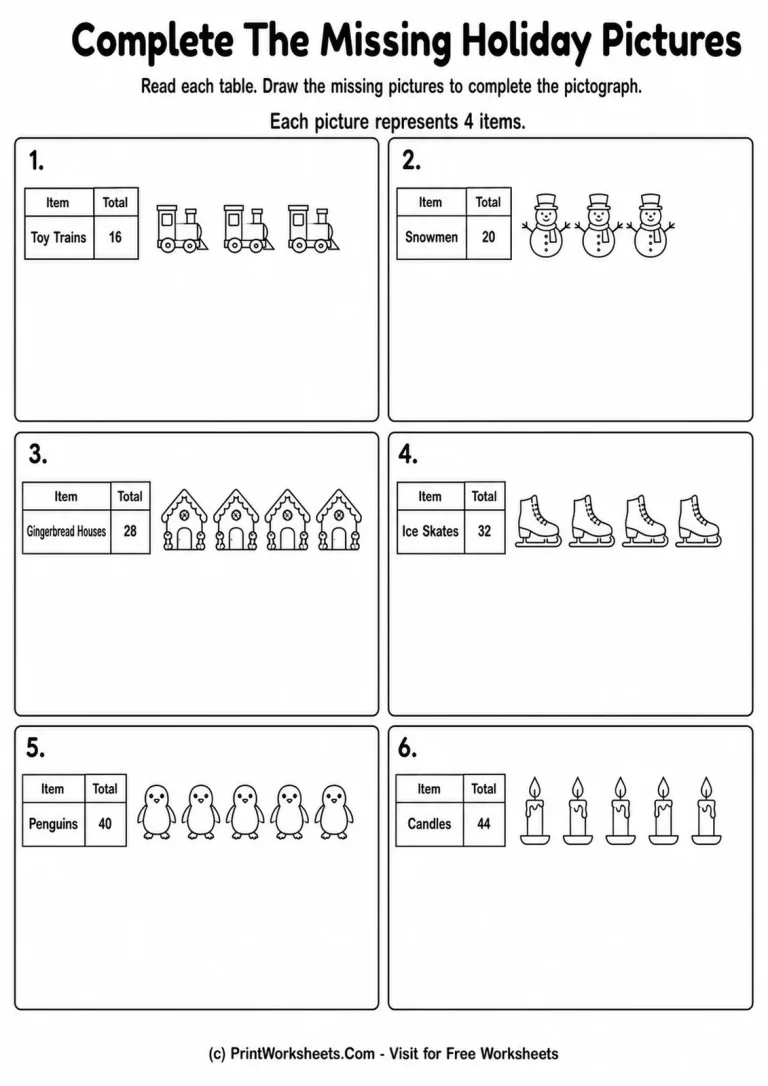
The second approved activity changes the student task from reading data to completing it. Each picture represents 4 items, and six small tables give target totals for toy trains, snowmen, gingerbread houses, ice skates, penguins, and candles. Some pictures are already shown, and students draw the missing pictures needed to reach each total.
The totals increase from 16 to 44, so students first determine how many complete pictures are required and then compare that number with the pictures already provided. The six problems require 4, 5, 7, 8, 10, and 11 total pictures respectively. Since the worksheet is arranged so that students add 1, 2, 3, 4, 5, and 6 missing pictures across the problems, it provides a clear progression without introducing fractional symbols.
Teachers who want an easier pictograph review before this level can also use pictograph questions with scales for Grade 2. It works well as a prerequisite for students who still need practice applying a pictograph key.
Apply the scale in short story problems
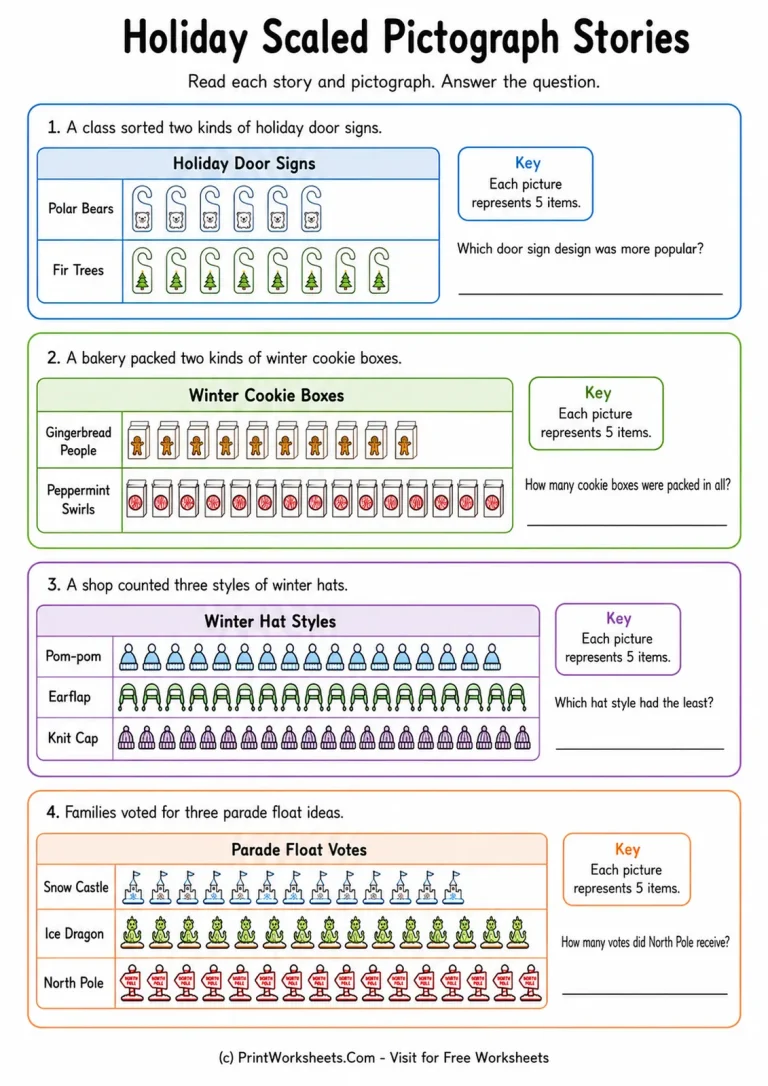
The final worksheet places pictographs inside four short holiday and winter situations. Each picture represents 5 items. Students compare holiday door sign choices, calculate the total number of winter cookie boxes, identify the least common winter hat style, and determine how many votes the North Pole parade float received.
These questions require different operations even though the scale stays the same. One problem is a comparison task, one combines two pictograph rows before multiplying by the scale, one asks students to identify the smallest category, and one converts a row of symbols directly into a vote total. Keeping the key fixed at 5 lets students concentrate on interpreting what each question is asking.
Connect pictographs to other Grade 3 graph skills
Scaled pictographs are a useful bridge to graphs where the scale appears on an axis instead of in a picture key. After students are comfortable converting symbols into quantities, they can continue with scaled bar graph worksheets for Grade 3. For students who benefit from reviewing how raw counts are organized before graphing, tally chart data questions provide another useful data-and-graphing connection.
Ways to use these worksheets
The three activities can be used in sequence or selected according to the skill being taught. Use the ornament page for independent pictograph reading, the missing-picture page when students need to construct or complete a representation from numerical totals, and the story page when the goal is choosing the correct operation from context. A simple extension is to ask students to explain how they used the key before giving a numerical answer. This makes it easier to see whether a wrong answer came from counting the symbols, applying the scale, or interpreting the question.
Together, the worksheets provide a compact Grade 3 practice set that moves from interpreting an existing pictograph to completing one and finally using scaled data in short real-world-style questions.