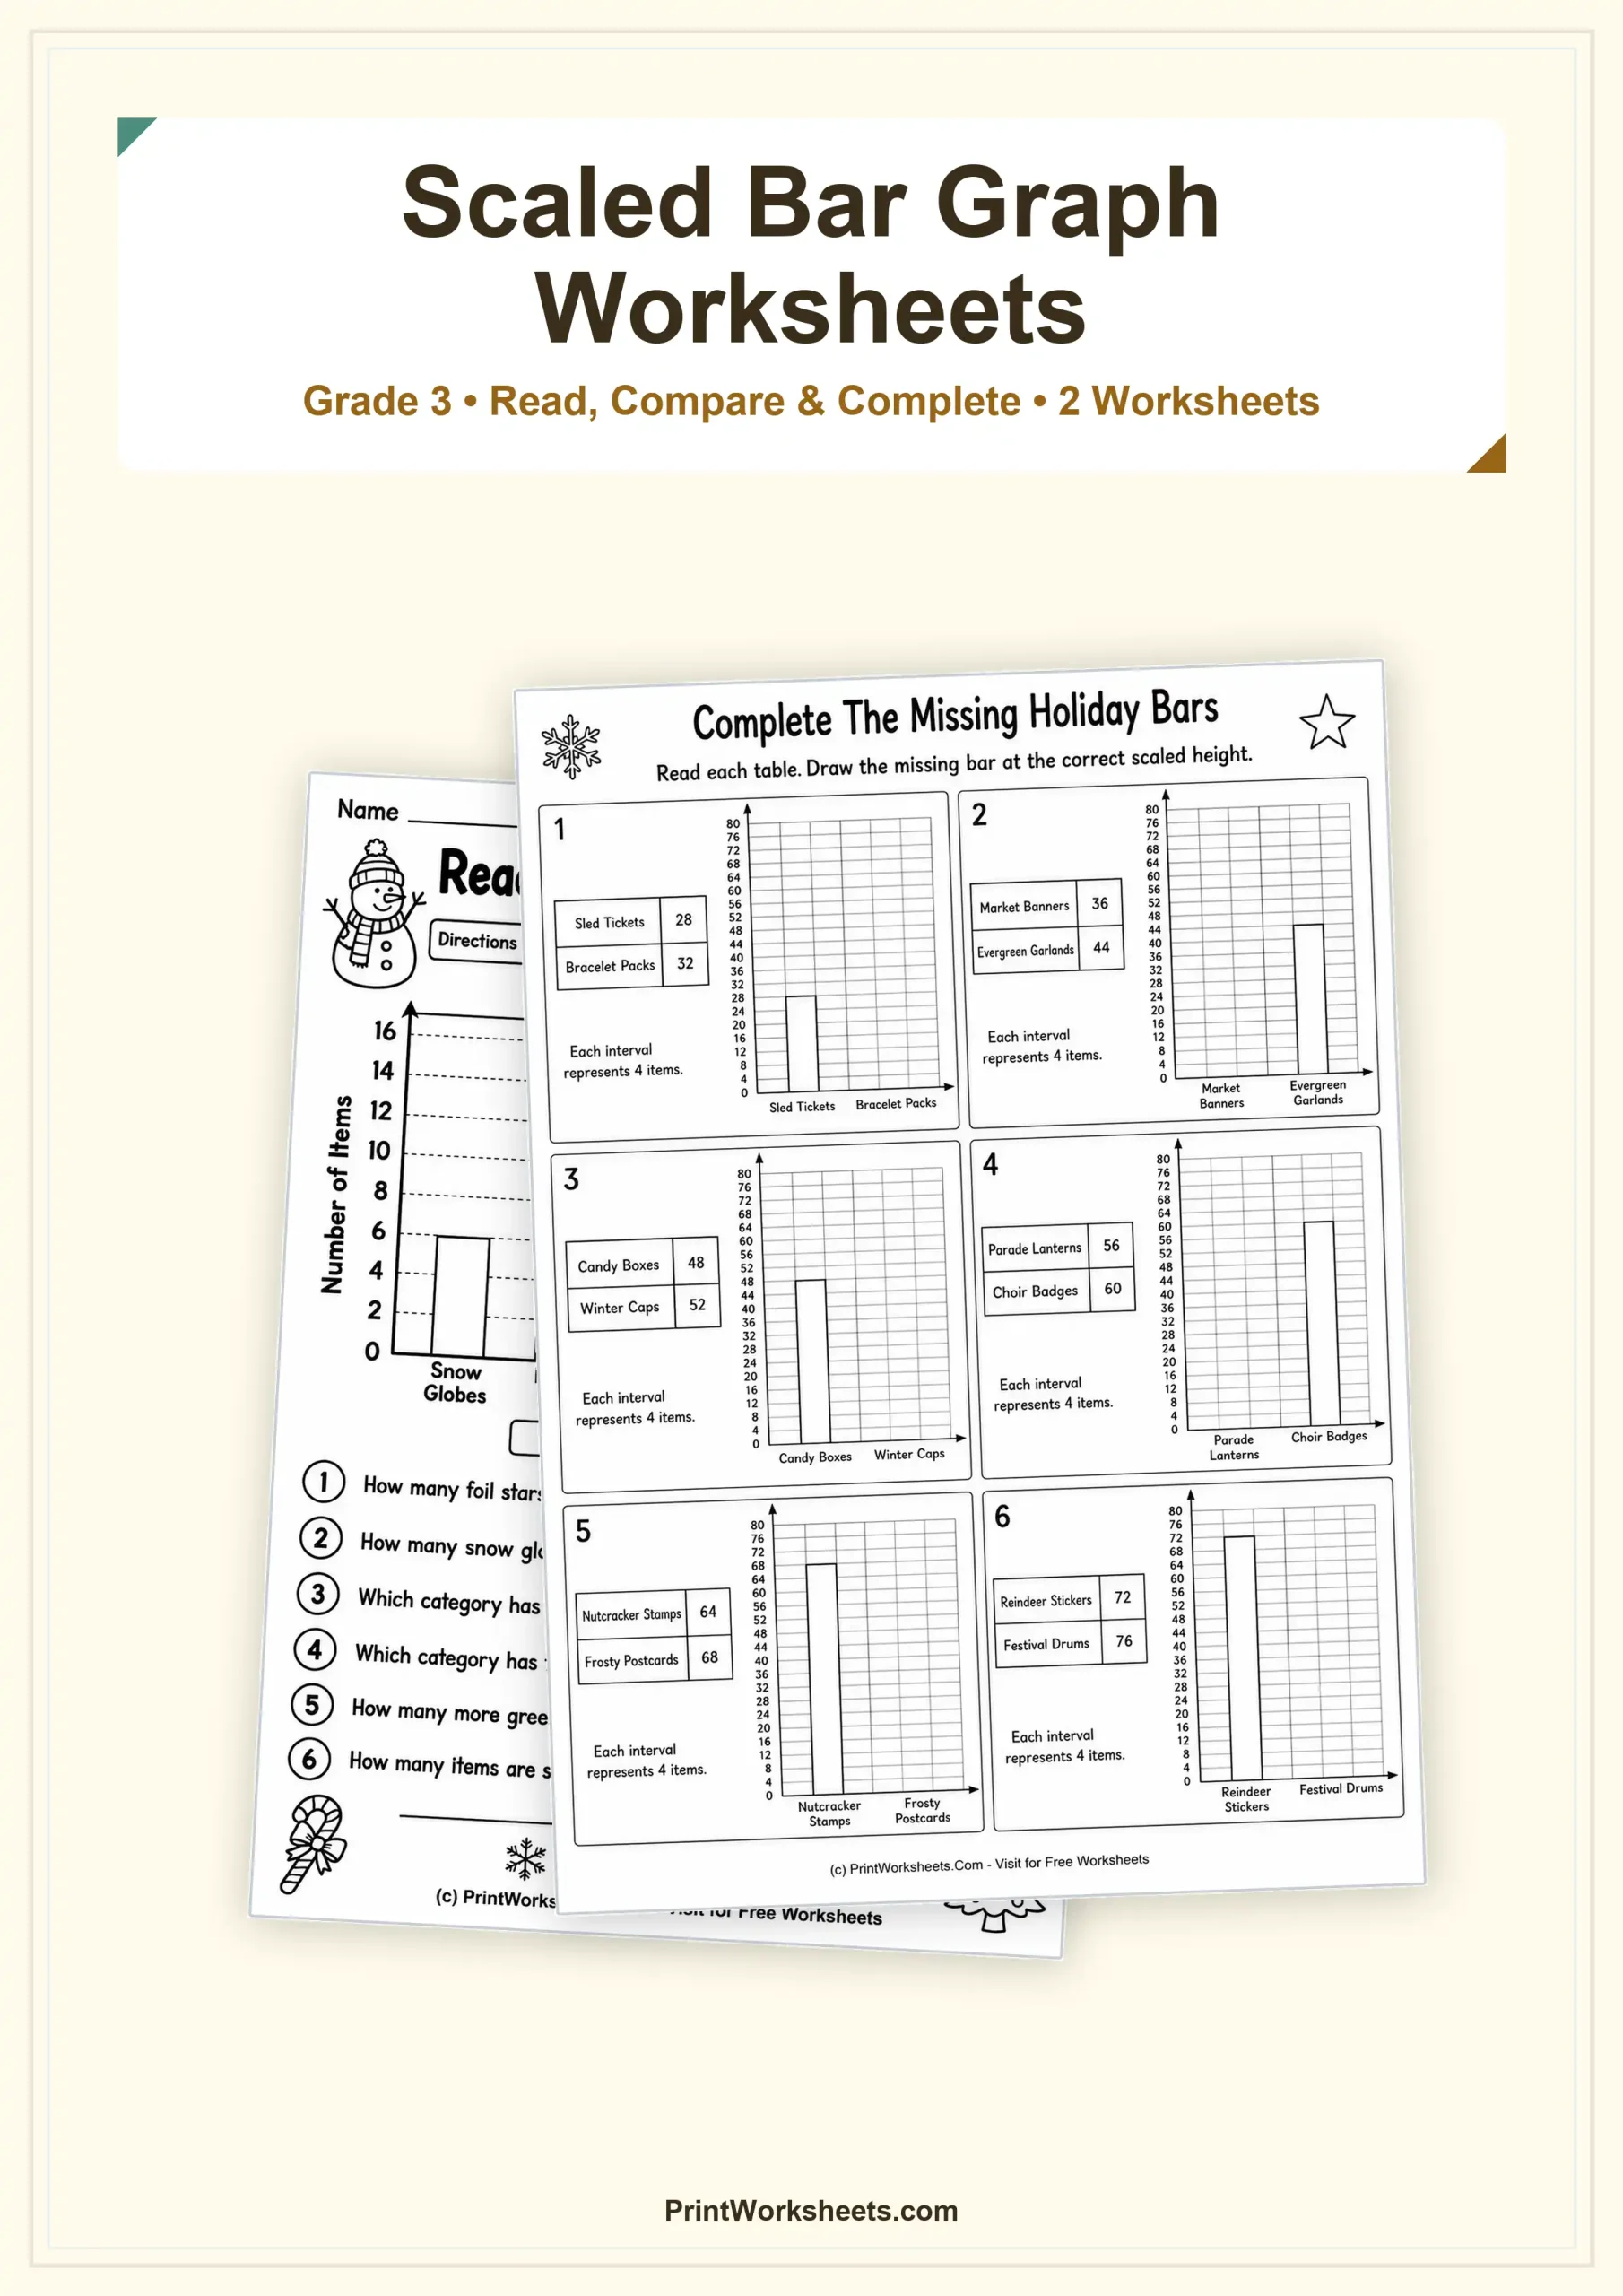
These scaled bar graph worksheets give third graders practice with an important step beyond reading a basic graph: understanding what each interval on the scale represents. The two printable activities use different scales and different student actions, so children must pay attention to the axis instead of assuming that every grid line stands for one item. One worksheet focuses on interpreting a completed holiday bar graph, while the other asks students to use table values to finish missing bars at the correct heights.
Scaled Bar Graph Worksheets with Two Different Scales
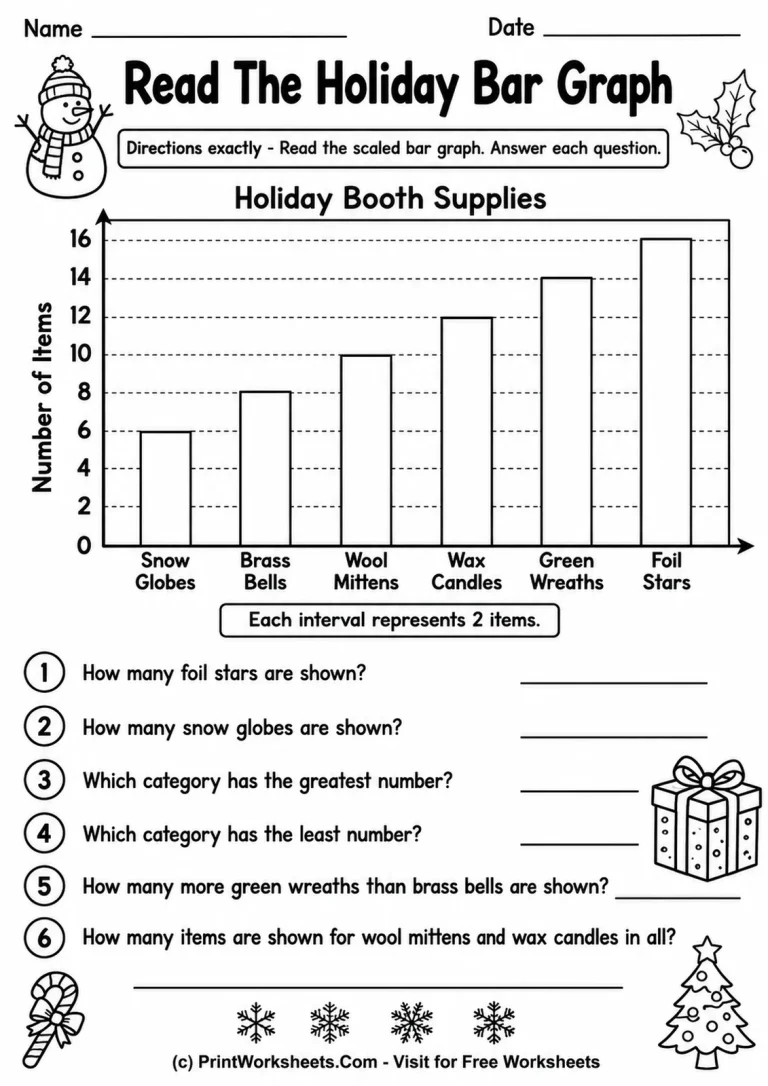
The first worksheet, Read The Holiday Bar Graph, presents a Holiday Booth Supplies graph with six categories: Snow Globes, Brass Bells, Wool Mittens, Wax Candles, Green Wreaths, and Foil Stars. Each interval represents 2 items. The bars rise from 6 items for Snow Globes to 16 items for Foil Stars, giving students a clear sequence of even-numbered values to interpret.
Students answer six questions below the graph. They identify exact quantities, determine which category has the greatest and least number, compare Green Wreaths with Brass Bells, and combine the quantities for Wool Mittens and Wax Candles. This mixes direct graph reading with subtraction and addition, helping students connect data displays to familiar Grade 3 computation skills.
Teachers who want students to review the earlier step of creating a graph from numerical information can also use the bar graphs from tables worksheets. That related activity works well as a bridge before students move into scaled intervals.
Complete Missing Bars from Data Tables
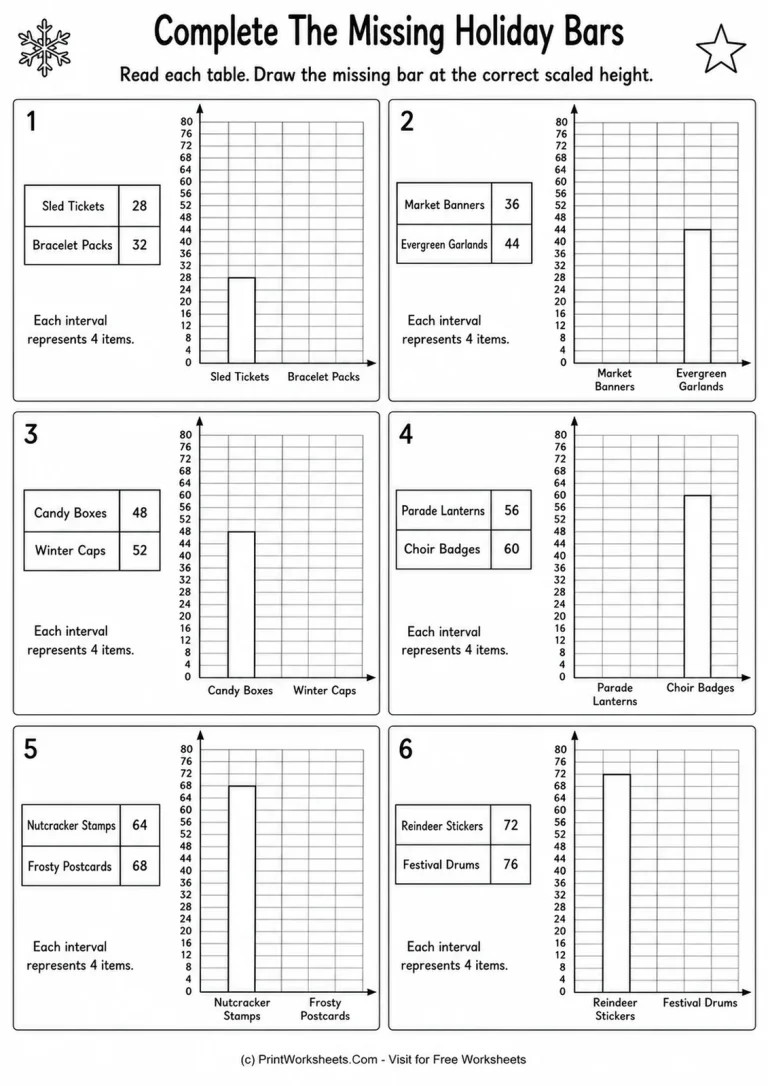
The second worksheet changes the task rather than repeating another set of reading questions. In Complete The Missing Holiday Bars, students see six separate table-and-graph panels. Each interval represents 4 items, and one bar is already drawn in every panel. Students must read the second value from the table and draw the missing bar at the correct scaled height.
The data include pairs such as Sled Tickets and Bracelet Packs, Market Banners and Evergreen Garlands, Candy Boxes and Winter Caps, Parade Lanterns and Choir Badges, Nutcracker Stamps and Frosty Postcards, and Reindeer Stickers and Festival Drums. Missing values include 32, 36, 52, 56, 68, and 76. Because all of these values are multiples of 4, students can use the printed scale consistently while still working across a wide numerical range.
What Students Practice on These Grade 3 Bar Graph Pages
Together, the worksheets build several connected data skills. Students must locate a category, follow its bar to the numbered axis, interpret a scale that increases by more than one, compare two categories, calculate a difference, find a combined total, and translate a value from a table into a bar of the correct height. The shift from intervals of 2 on the reading page to intervals of 4 on the drawing page also encourages students to check the scale before solving each problem.
If students need more experience with scaled representations before working with bars, the scaled pictograph worksheets offer a related visual-data skill. For additional comparison practice with another graph type, the picture graph comparison worksheets focus on reading quantities and comparing categories.
Ways to Use the Worksheets
The reading page can work well as guided practice because every question refers to one shared graph. A teacher can model how to read the vertical scale, then have students complete the remaining questions independently. The missing-bar page is useful for independent work, math centers, homework, or a short follow-up assessment because students must apply the scale repeatedly across six separate graphs.
A simple teaching routine is to ask students to circle or underline the statement that explains the interval before they begin. On the first page, they should notice that each interval represents 2 items; on the second, each interval represents 4 items. That small habit helps prevent one of the most common mistakes with scaled graphs: counting grid lines as single units. By the end of the set, students have practiced both interpreting existing data and representing table values on scaled bar graphs.