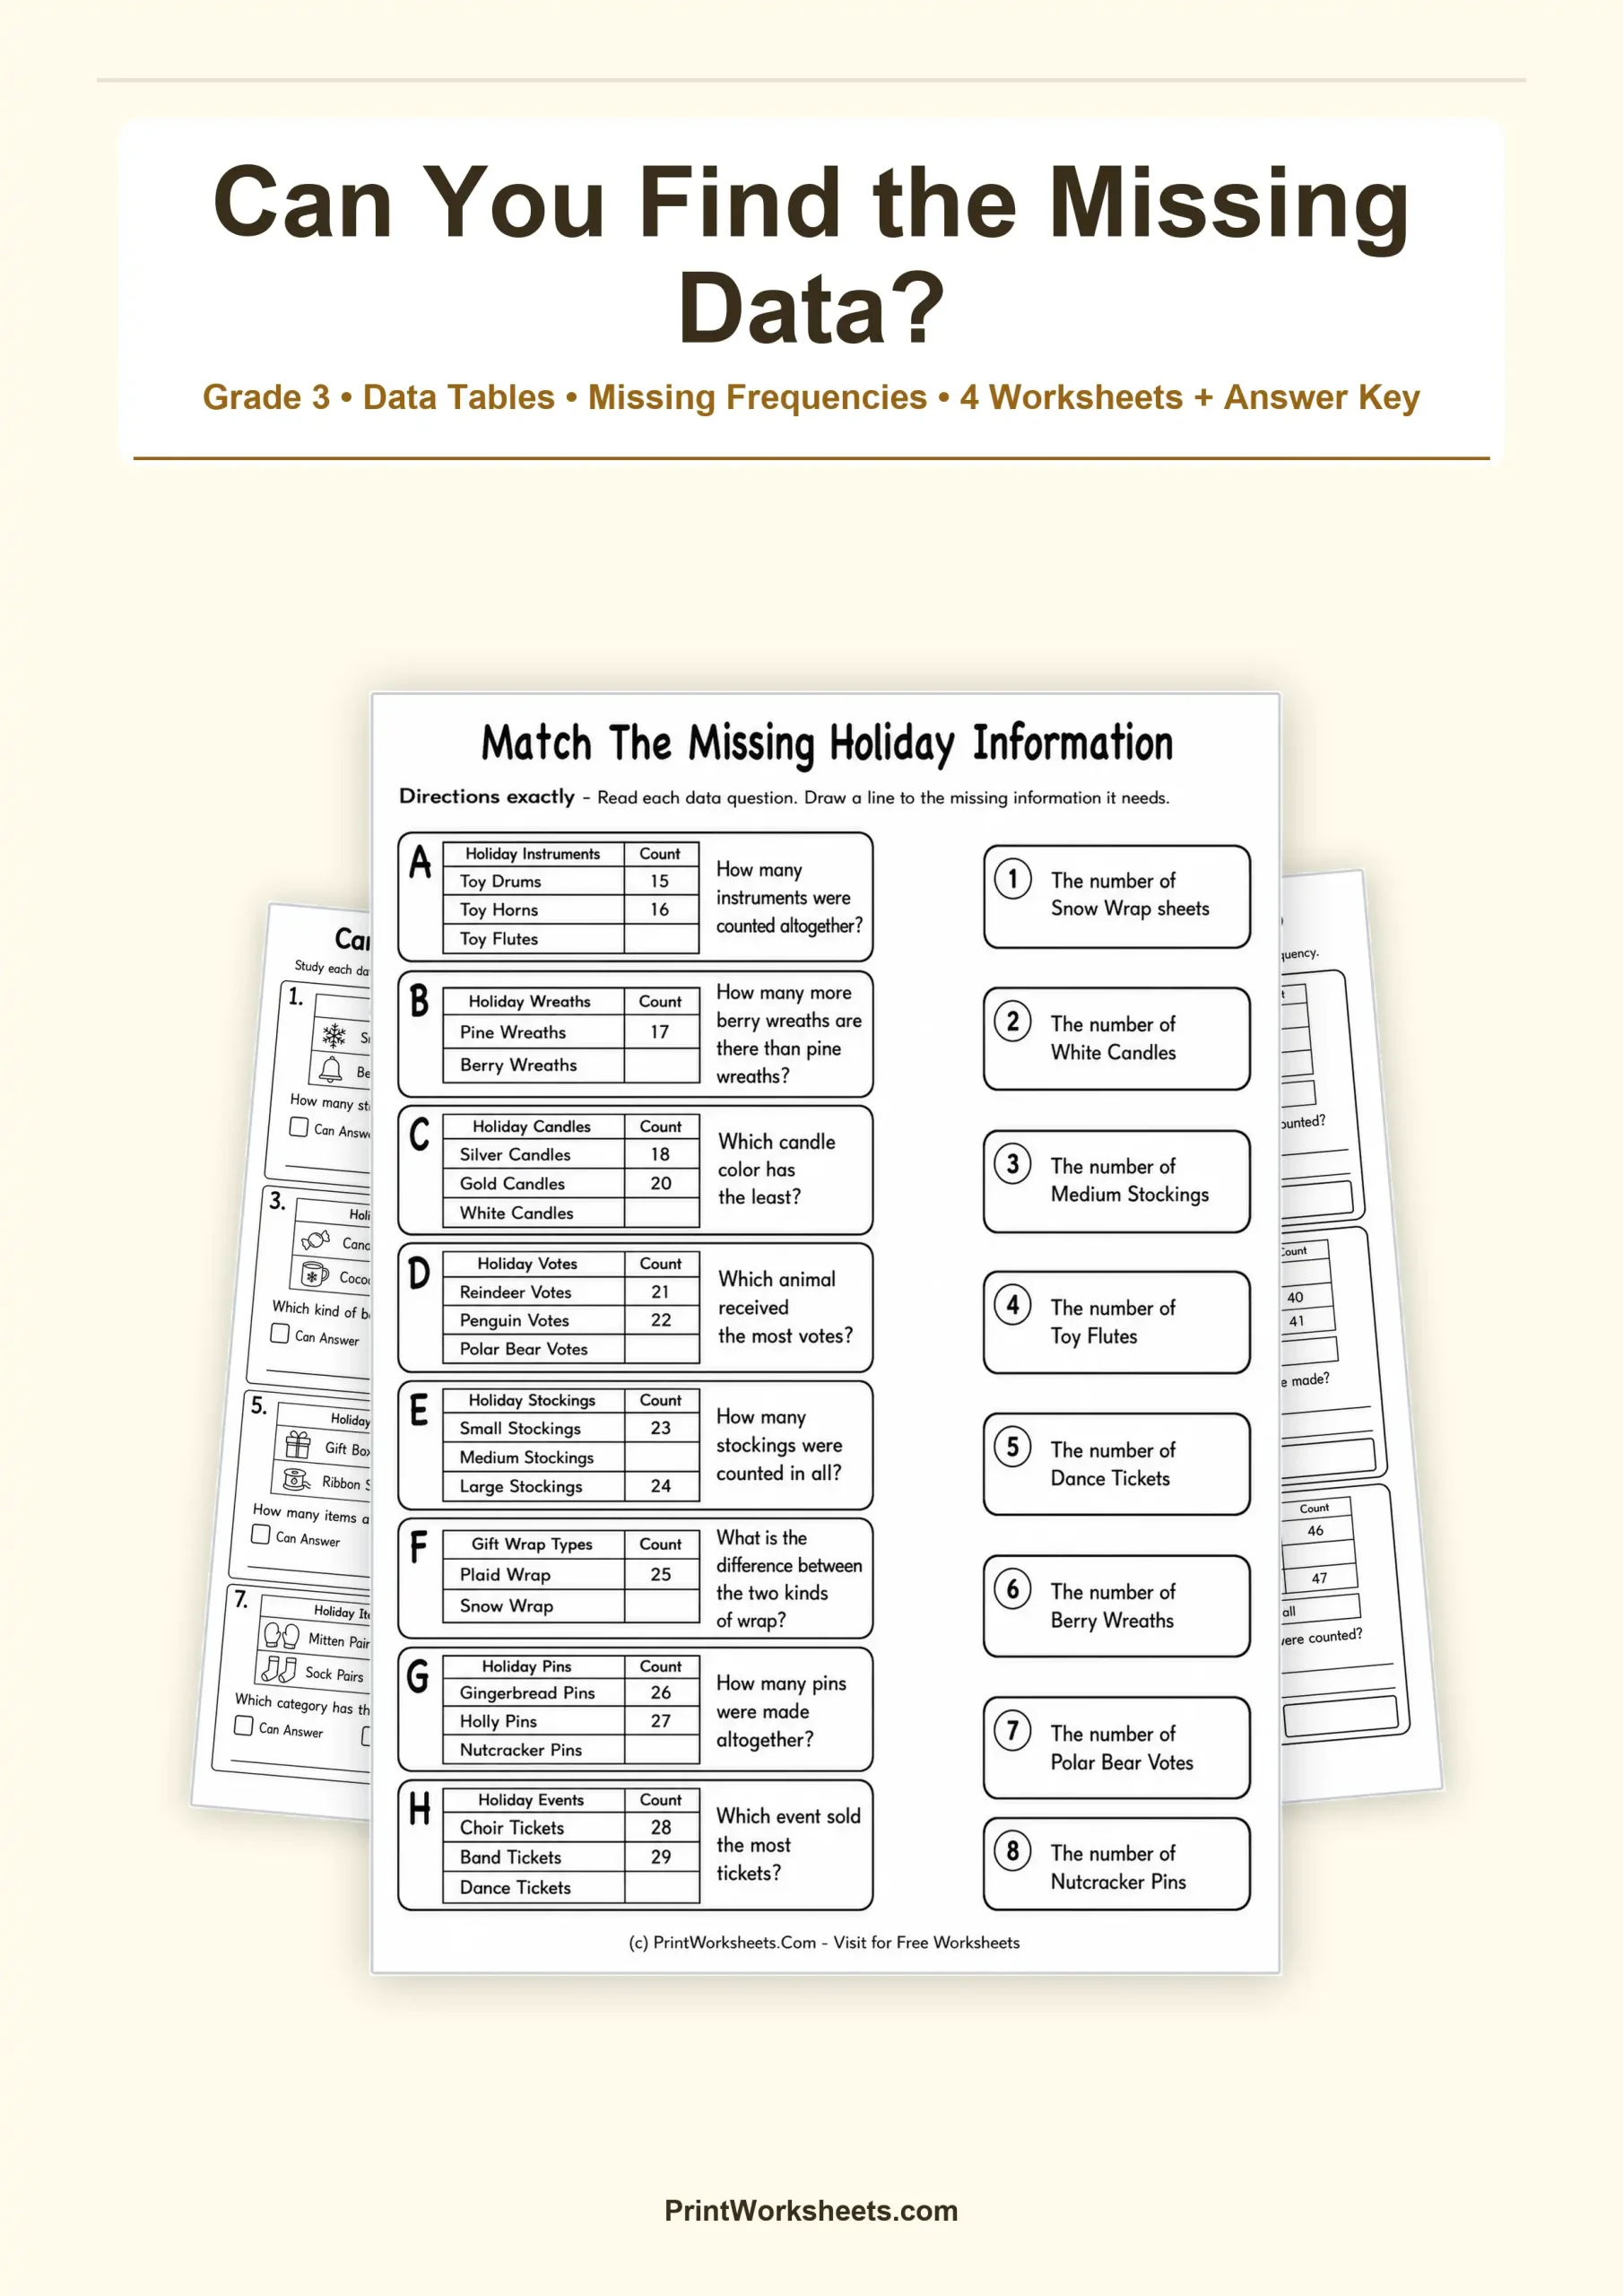
These missing information worksheets give Grade 3 students a different kind of data challenge: before calculating, they must decide whether the information they need is actually available. Across four printable activities, students read small frequency tables, compare values, identify absent facts, find missing frequencies from totals, and solve holiday-themed data problems. The set moves from quick decisions to more involved reasoning, making it useful for students who already understand basic tables but need practice thinking carefully about what the data does and does not tell them.
How These Missing Information Worksheets Build Data Reasoning
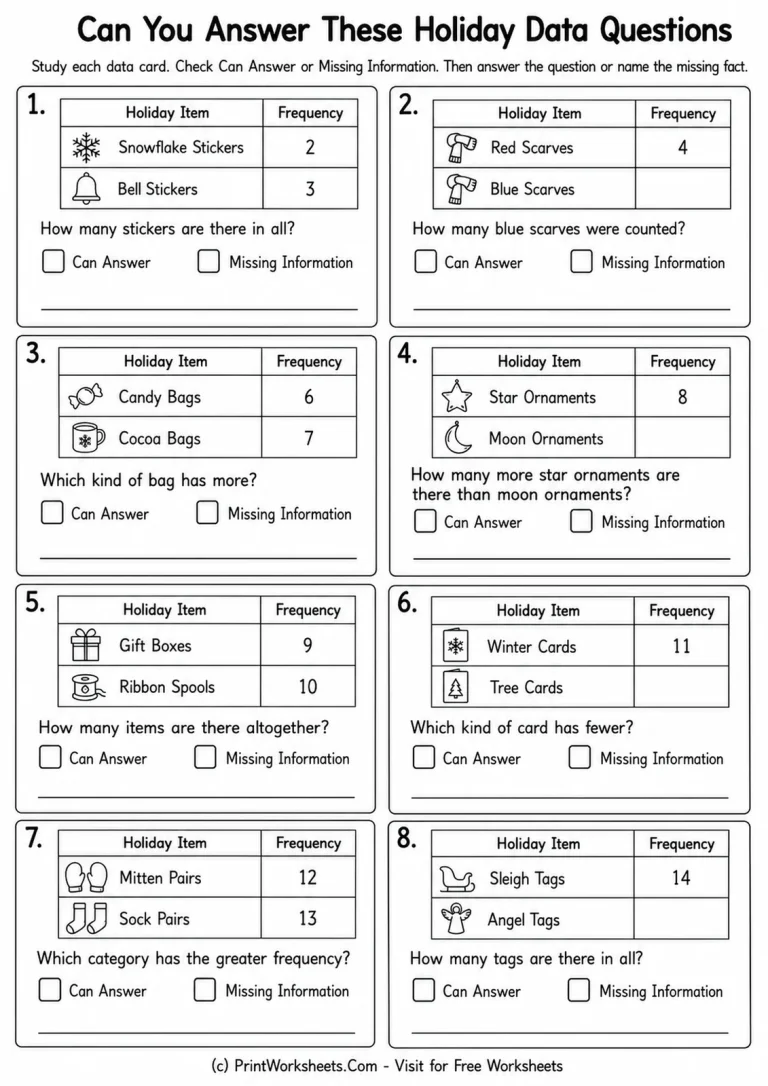
The first worksheet uses eight compact data cards. Each card includes two categories and a question, followed by choices for Can Answer or Missing Information. Some questions are fully solvable, such as combining 2 Snowflake Stickers and 3 Bell Stickers to find 5 stickers in all. Others intentionally leave out a needed value. A student who is asked how many Blue Scarves were counted, for example, must recognize that the Blue Scarves frequency is blank rather than trying to invent a number.
This distinction matters because successful data problem solving is not only about computation. Students need to notice whether the evidence supports the question. The worksheet also includes comparison prompts, such as deciding which bag or clothing category has the greater or smaller frequency. That gives children practice checking both the wording of the question and the completeness of the table.
Identify the Exact Fact That Is Missing
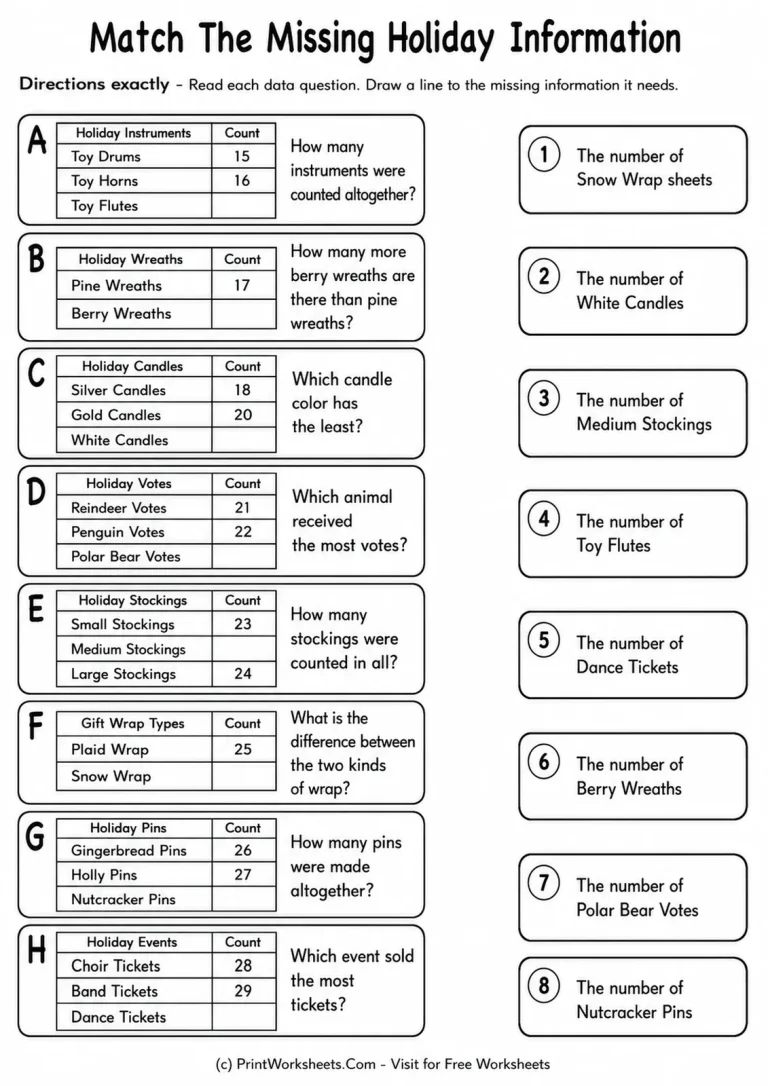
The second activity turns data sufficiency into a matching task. Eight tables labeled A through H each contain one missing count. Students read the related question and match it to the specific piece of information needed, such as the number of Toy Flutes, Berry Wreaths, White Candles, Polar Bear Votes, Medium Stockings, Snow Wrap sheets, Nutcracker Pins, or Dance Tickets.
This format pushes students beyond simply saying that something is missing. They have to name the exact fact that would make the question answerable. For example, a question asking for the total number of instruments cannot be completed when the Toy Flutes count is absent, while a question asking which candle color has the least cannot be resolved without the White Candles count. That makes the activity especially useful for developing careful reading and mathematical reasoning.
Find Missing Frequencies From a Known Total
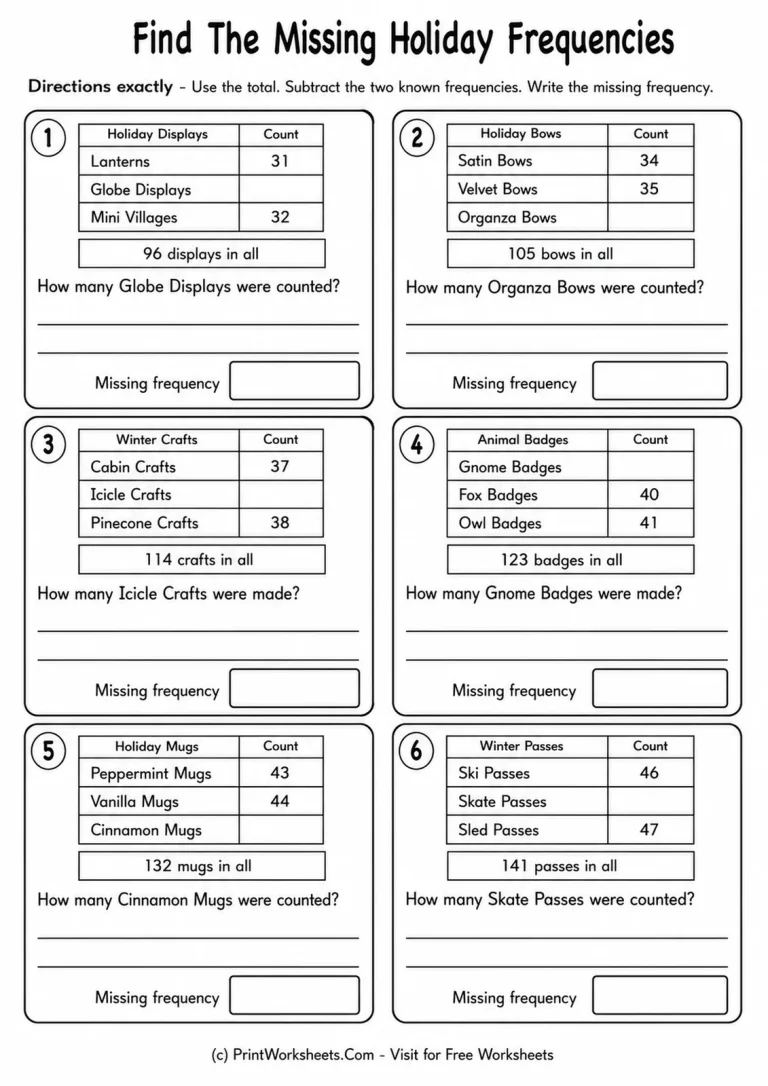
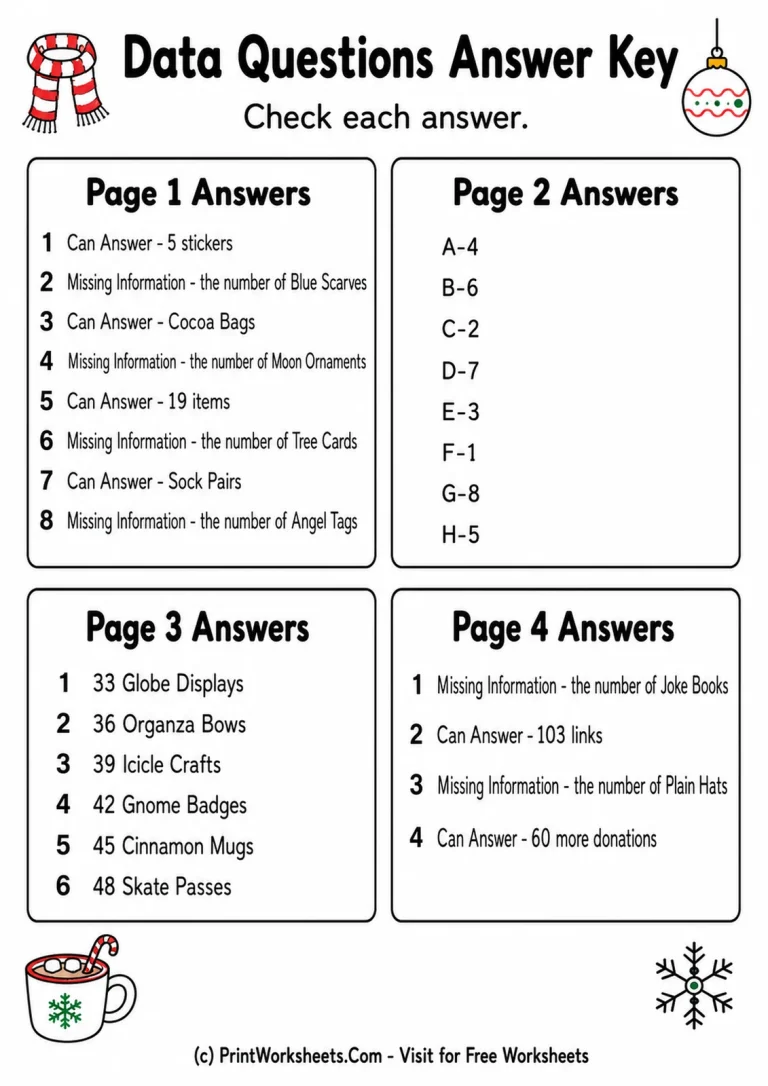
The third worksheet changes the task from identifying missing data to calculating it. Each problem shows three categories, two known frequencies, and a total. Students subtract the two known values from the total to determine the missing frequency. The six problems produce answers of 33 Globe Displays, 36 Organza Bows, 39 Icicle Crafts, 42 Gnome Badges, 45 Cinnamon Mugs, and 48 Skate Passes.
The numbers are large enough to provide meaningful Grade 3 addition and subtraction practice while the table structure keeps the purpose clear. Students can check that their result makes sense by adding all three frequencies and confirming that they match the stated total. This creates a natural connection between data interpretation and inverse operations.
Apply the Skill to Holiday Data Word Problems
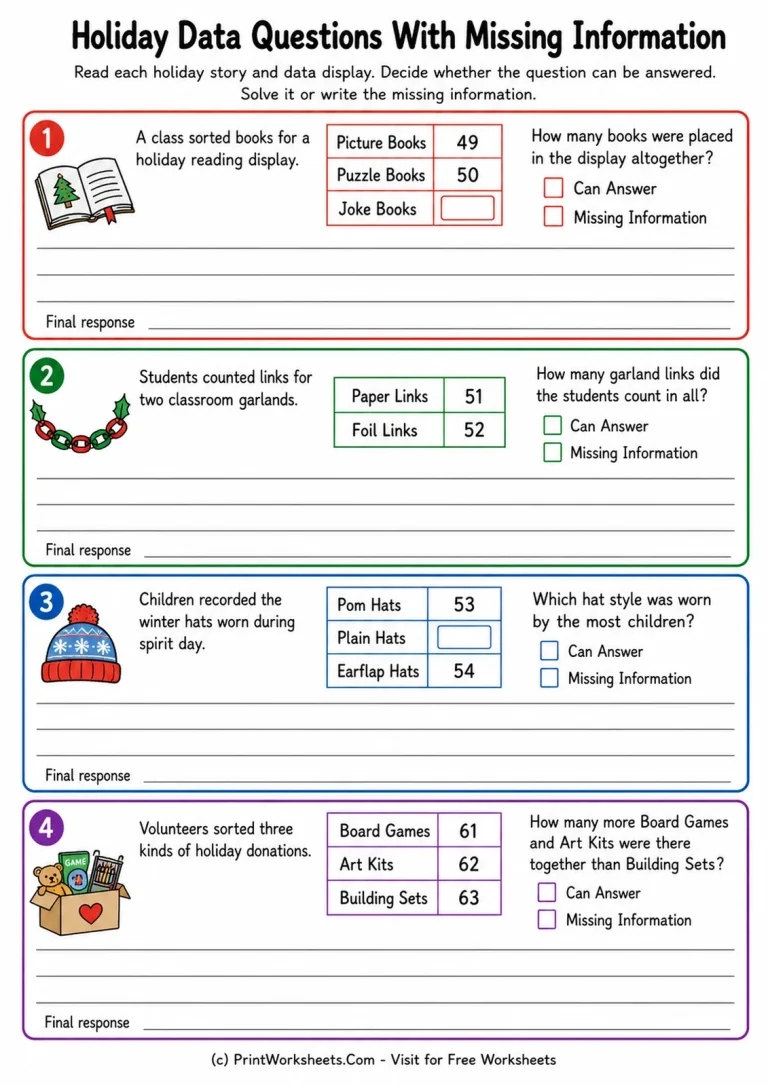
The final student page presents four larger story problems using books, classroom garland links, winter hats, and holiday donations. Students again decide whether each question can be answered, but now the reasoning is embedded in a short real-world context. One problem cannot be solved because the number of Joke Books is missing. Another gives 51 Paper Links and 52 Foil Links, allowing students to find a total of 103 links.
The winter-hat problem requires students to notice that the Plain Hats value is absent before deciding which style was worn by the most children. The donation problem provides all three counts and asks a more advanced comparison: Board Games and Art Kits together versus Building Sets. Students calculate 61 + 62 – 63 to find a difference of 60 donations. This final task gives the set a useful progression from identifying missing information to applying data reasoning in a multi-step situation.
Ways to Use This Grade 3 Data Set
Teachers can use the worksheets in sequence for a short data-reasoning unit, assign individual pages for independent practice, or use selected problems for small-group discussion. The first two pages work well when introducing the idea that not every question has enough information. The missing-frequency page provides focused computation practice, while the story-problem page is a strong follow-up for students ready to apply the same reasoning in context.
A complete answer key covers all four student worksheets, including the Can Answer and Missing Information decisions, the A-H matching activity, the six calculated frequencies, and the contextual problem answers. Together, the set gives Grade 3 learners repeated practice asking an important mathematical question before they calculate: do I have the information I need?