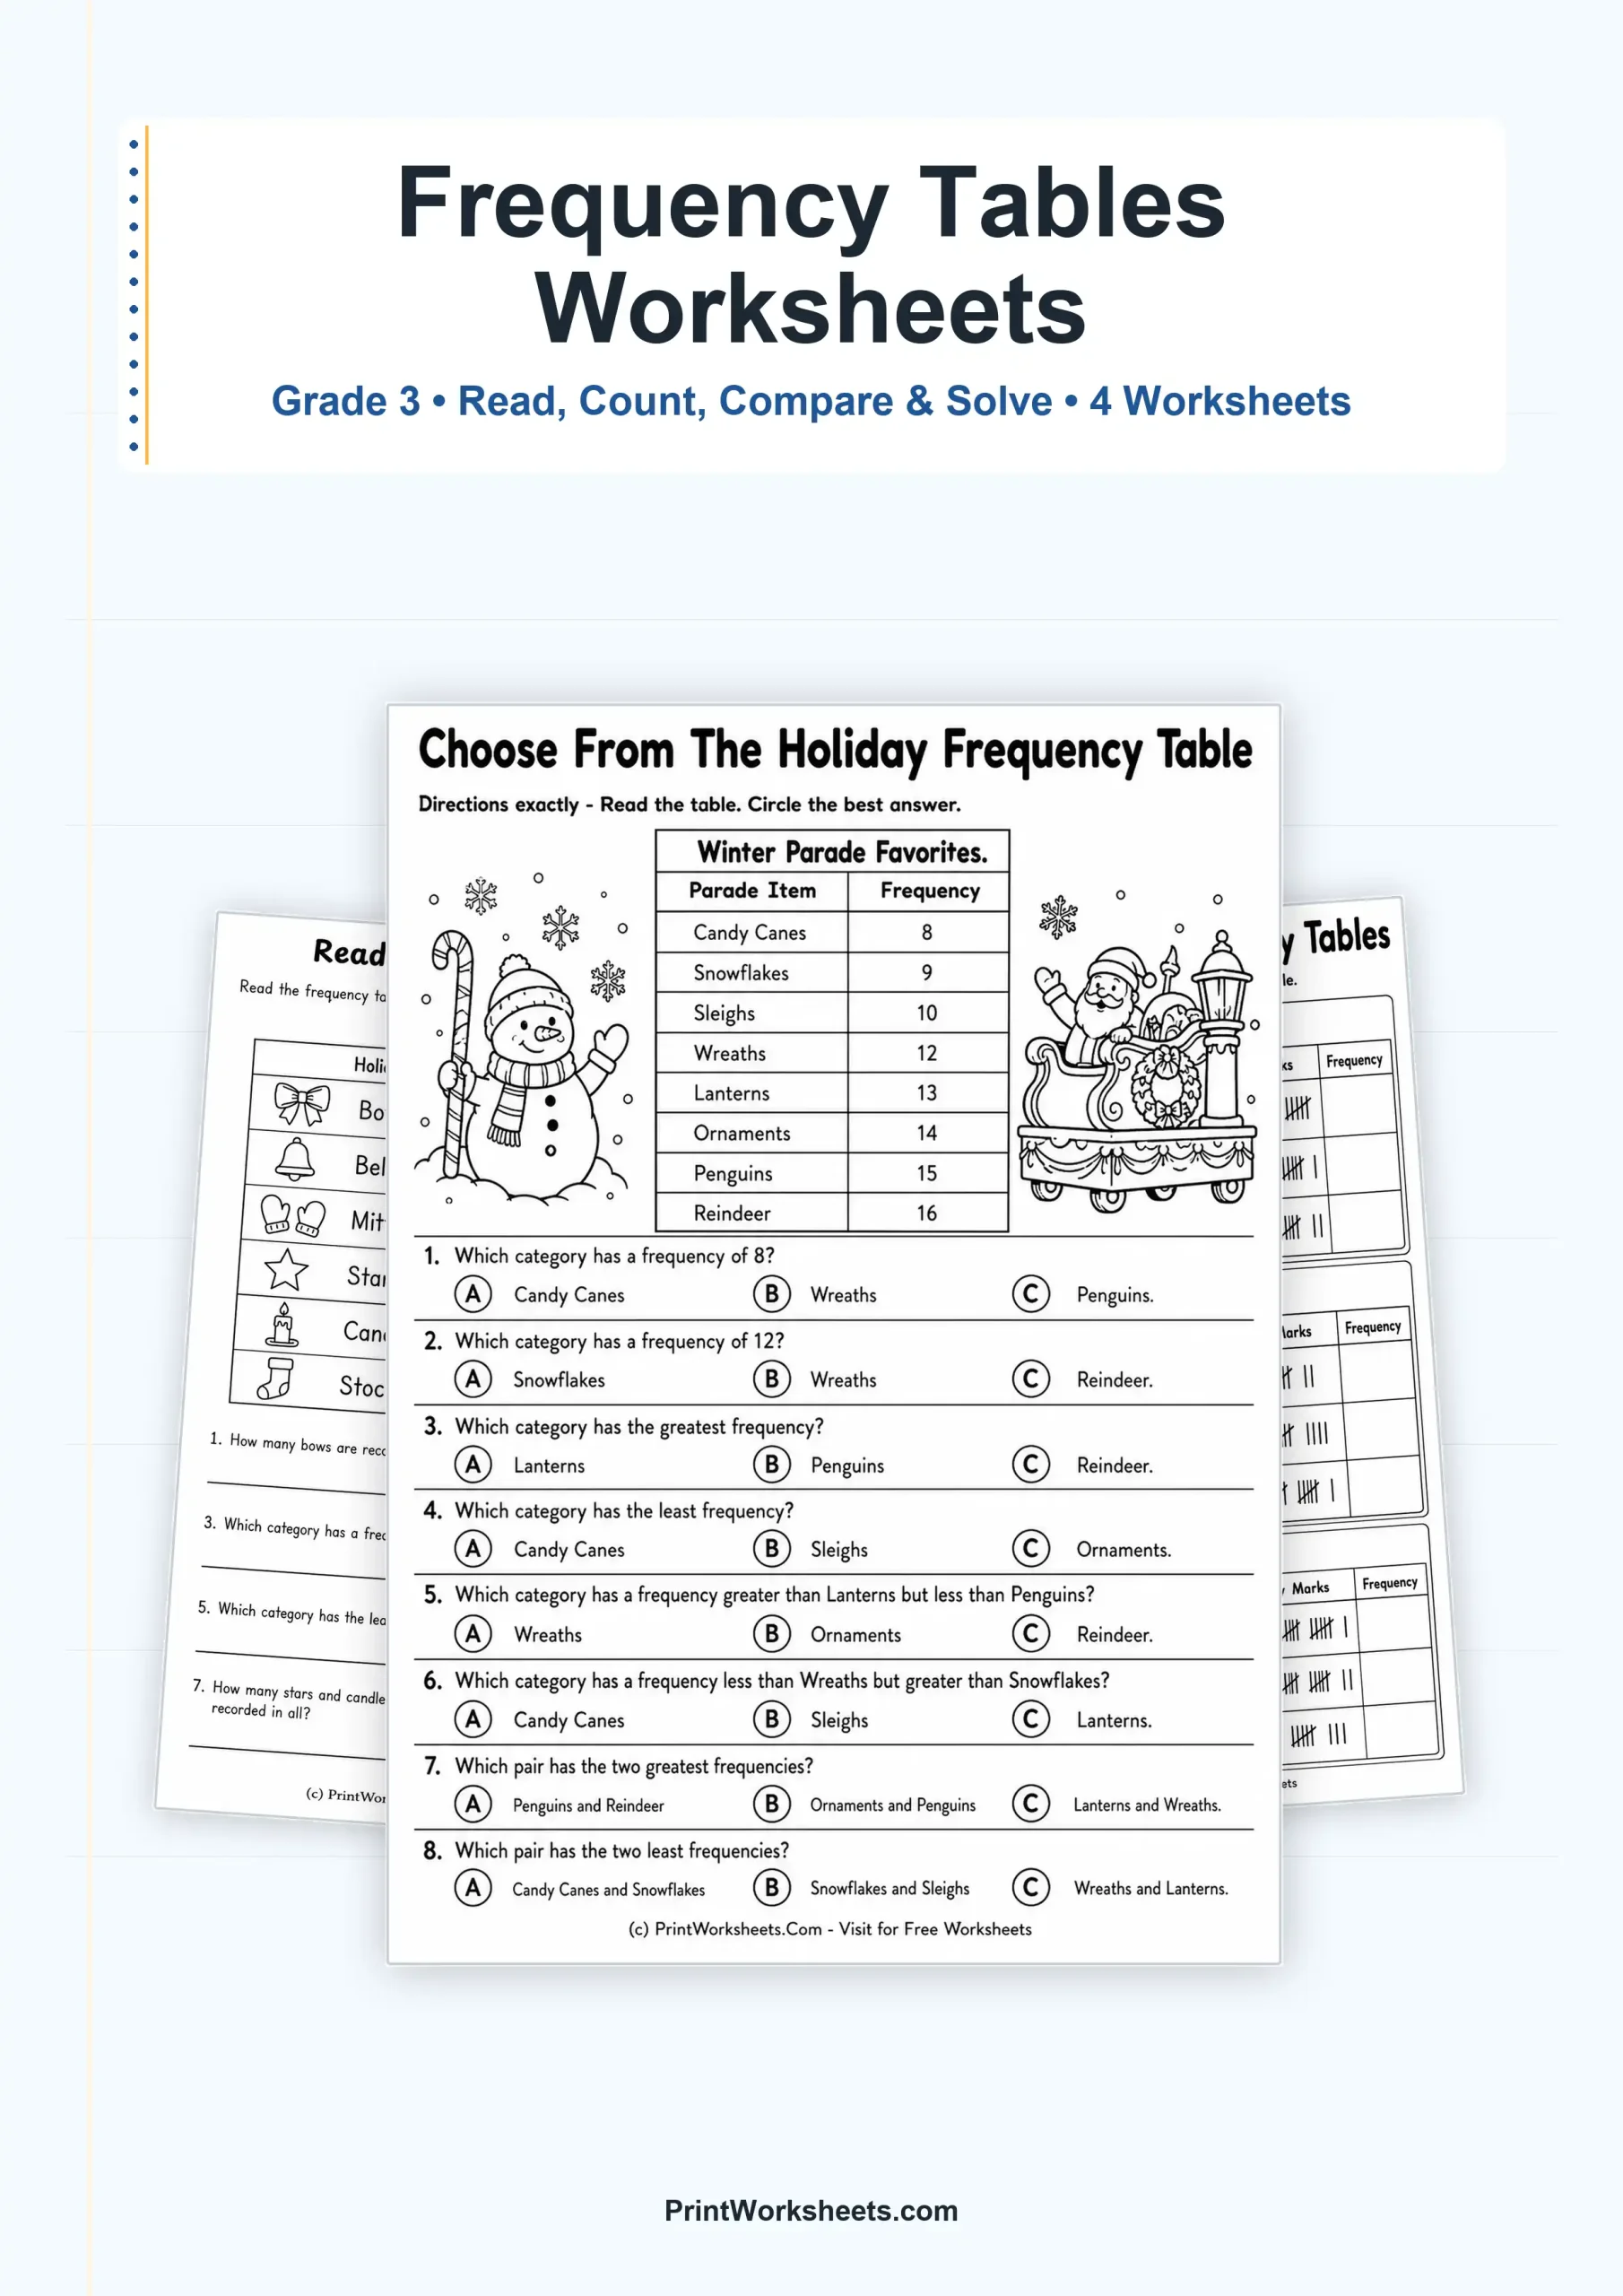
These frequency table worksheets give Grade 3 students a concrete way to practice reading, completing, comparing, and using data tables. Across four printable student pages, holiday-themed collections, parade favorites, tally marks, and short story situations turn frequency into something students can see and reason about. The set begins with straightforward table reading, then asks students to compare values, convert tally marks into numbers, and solve problems that require totals or missing frequencies.
Frequency Table Worksheets for Grade 3
The worksheets stay focused on one data skill while changing the way students interact with it. Students read category labels and frequencies, identify greatest and least values, find differences, combine categories, and calculate a whole-table total. Later pages shift from reading completed tables to constructing frequency entries from tally marks and using table data inside short word problems. This variety makes the set useful for introducing frequency tables, practicing after a lesson, or checking whether students can transfer the same concept into a new format.
Page 1: Read a Holiday Classroom Frequency Table
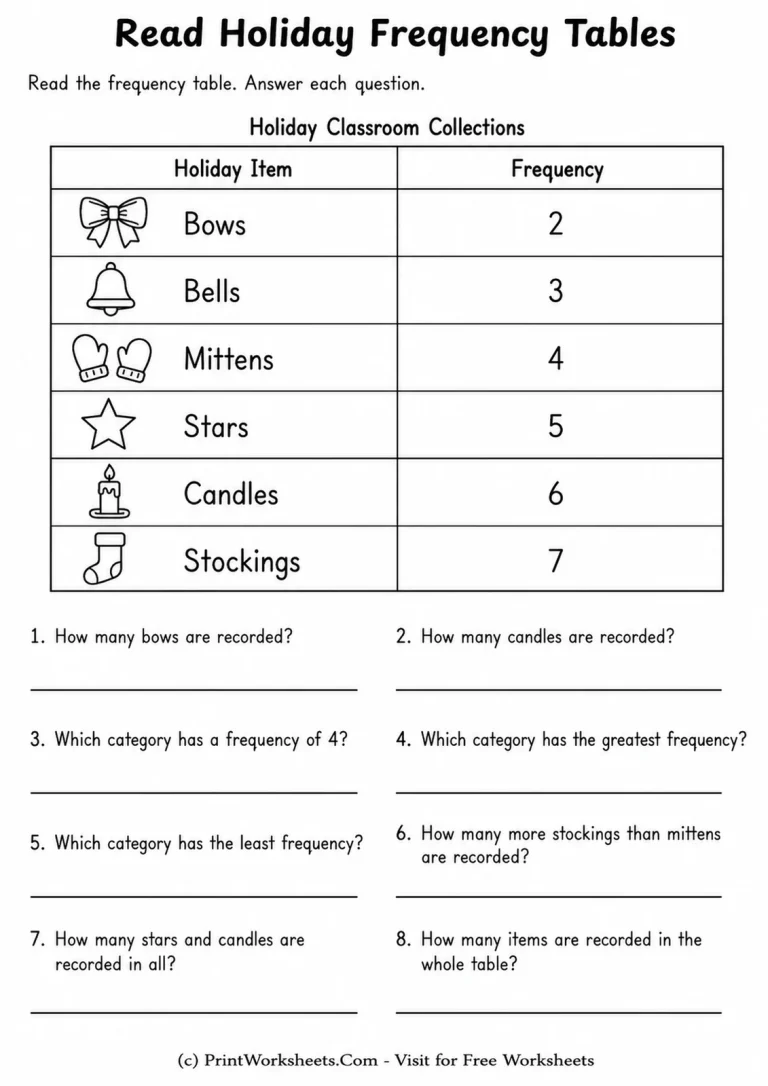
The first worksheet uses a Holiday Classroom Collections table with bows, bells, mittens, stars, candles, and stockings. Frequencies run from 2 through 7, so students can concentrate on understanding the table instead of handling difficult arithmetic. Eight short-answer questions ask for exact frequencies, the category with a frequency of 4, the greatest and least categories, the difference between stockings and mittens, the combined number of stars and candles, and the total number of items in the table. It is a clear entry point for students who are learning how rows, labels, and frequencies work together.
Page 2: Compare Values in a Multiple-Choice Table
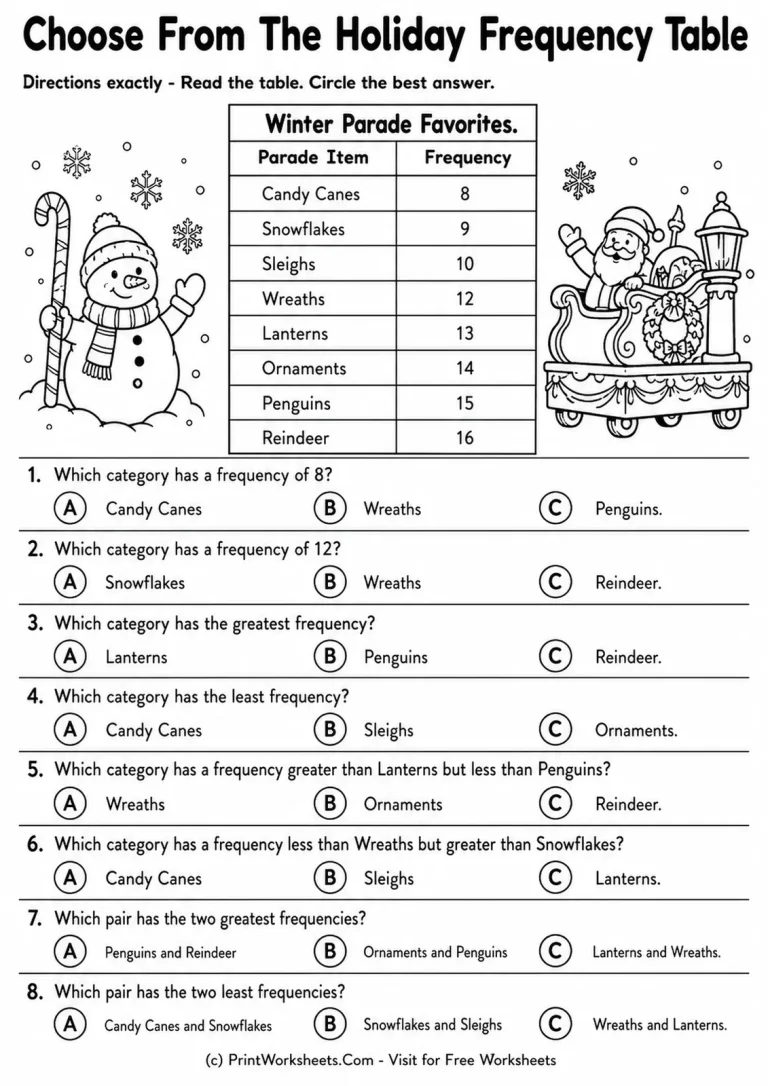
The second page increases the data range and changes the response format. A Winter Parade Favorites table lists eight categories with frequencies from 8 to 16. Students choose answers to questions about exact values, the greatest and least frequencies, a value that falls between two other categories, and the pairs with the two greatest or two least frequencies. Because the choices include plausible distractors, students need to read the table carefully rather than rely on a quick visual guess.
Page 3: Turn Tally Marks into Frequencies
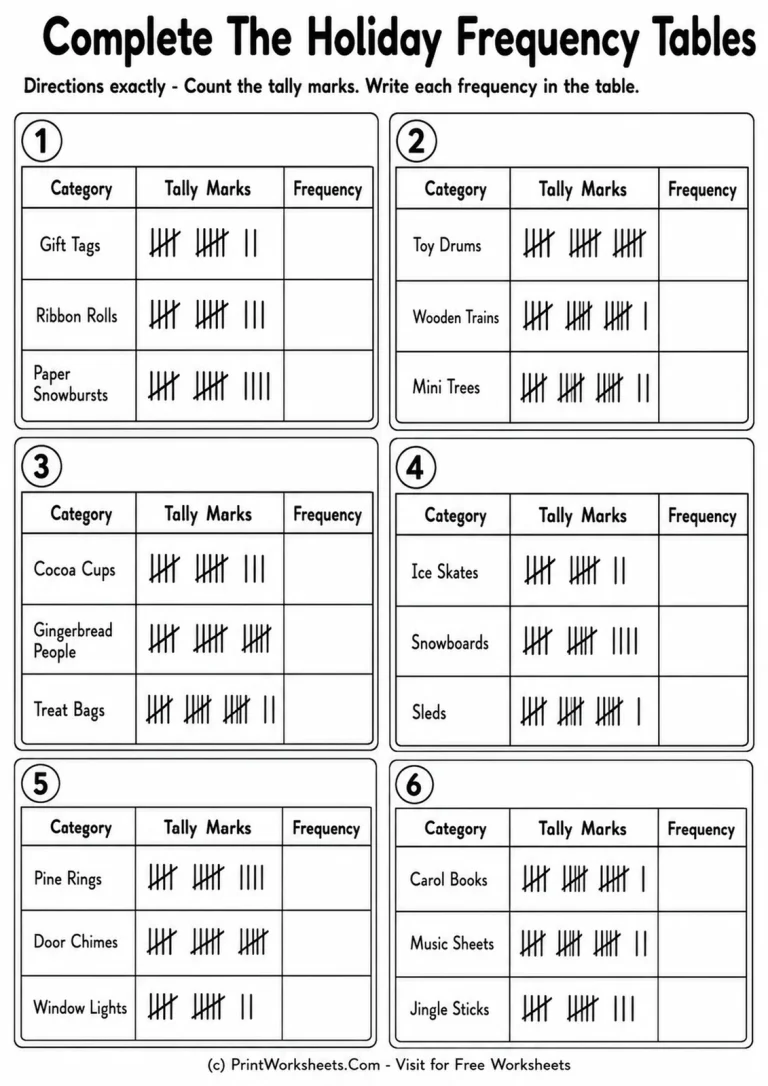
The third worksheet moves from interpreting a finished table to completing one. Six mini frequency tables contain holiday and winter categories such as gift tags, ribbon rolls, cocoa cups, snowboards, pine rings, carol books, and jingle sticks. Each row shows tally marks grouped in familiar sets of five, while the frequency cell is blank. Students count the marks and record the matching number. With 18 rows in total, this page gives repeated practice connecting tally notation to numerical frequency without adding unrelated graphing steps.
Page 4: Solve Frequency Table Stories
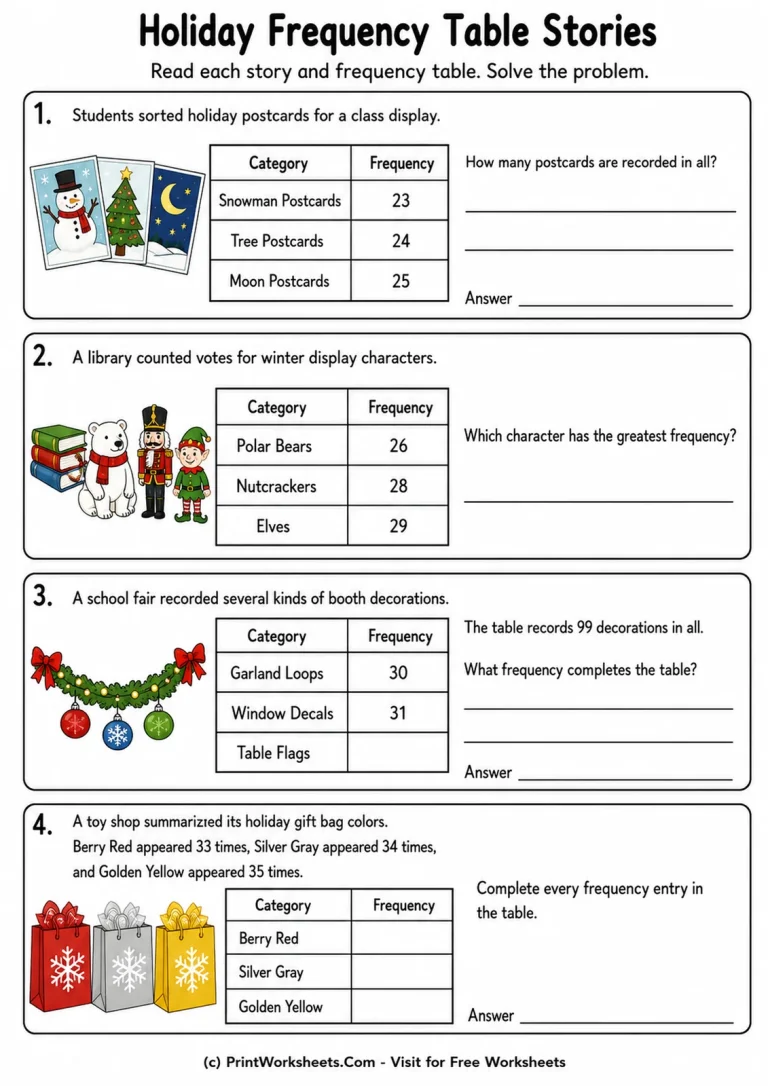
The final student page places frequency tables inside four short situations. Students total three postcard categories, identify the character with the greatest frequency, use a stated total of 99 to find a missing table entry, and transfer three frequencies from a short paragraph into an empty table. The values are mostly in the twenties and thirties, so students also practice addition and subtraction while keeping the main focus on data interpretation.
Data Skills Practiced Across the Set
These pages reinforce several Grade 3 data habits in a connected way. Students locate information by category, read exact frequencies, compare quantities, identify maximum and minimum values, find how many more one category has than another, combine selected categories, and calculate totals. They also learn that frequency can be represented in different forms: as a written number, as tally marks, or as information embedded in a story. That flexibility helps students understand the meaning of frequency instead of treating a table as a single worksheet format to memorize.
Ways to Use the Four Printable Pages
Teachers can use the pages in sequence during a data and graphing unit, but each worksheet also works independently. Page 1 fits guided practice or a quick warm-up, Page 2 works well for independent multiple-choice review, Page 3 provides a focused tally-mark center or homework task, and Page 4 is useful for application practice after students are comfortable reading tables. Parents can also use the set for short at-home sessions because the directions and tables are self-contained and the holiday theme keeps the data contexts easy to recognize.
A Focused Grade 3 Frequency Table Practice Set
Rather than repeating the same question pattern, the set gives students four distinct ways to work with frequency data. The progression from reading to comparing, completing, and solving makes it suitable for review, extra practice, math centers, or a compact printable data unit for Grade 3.