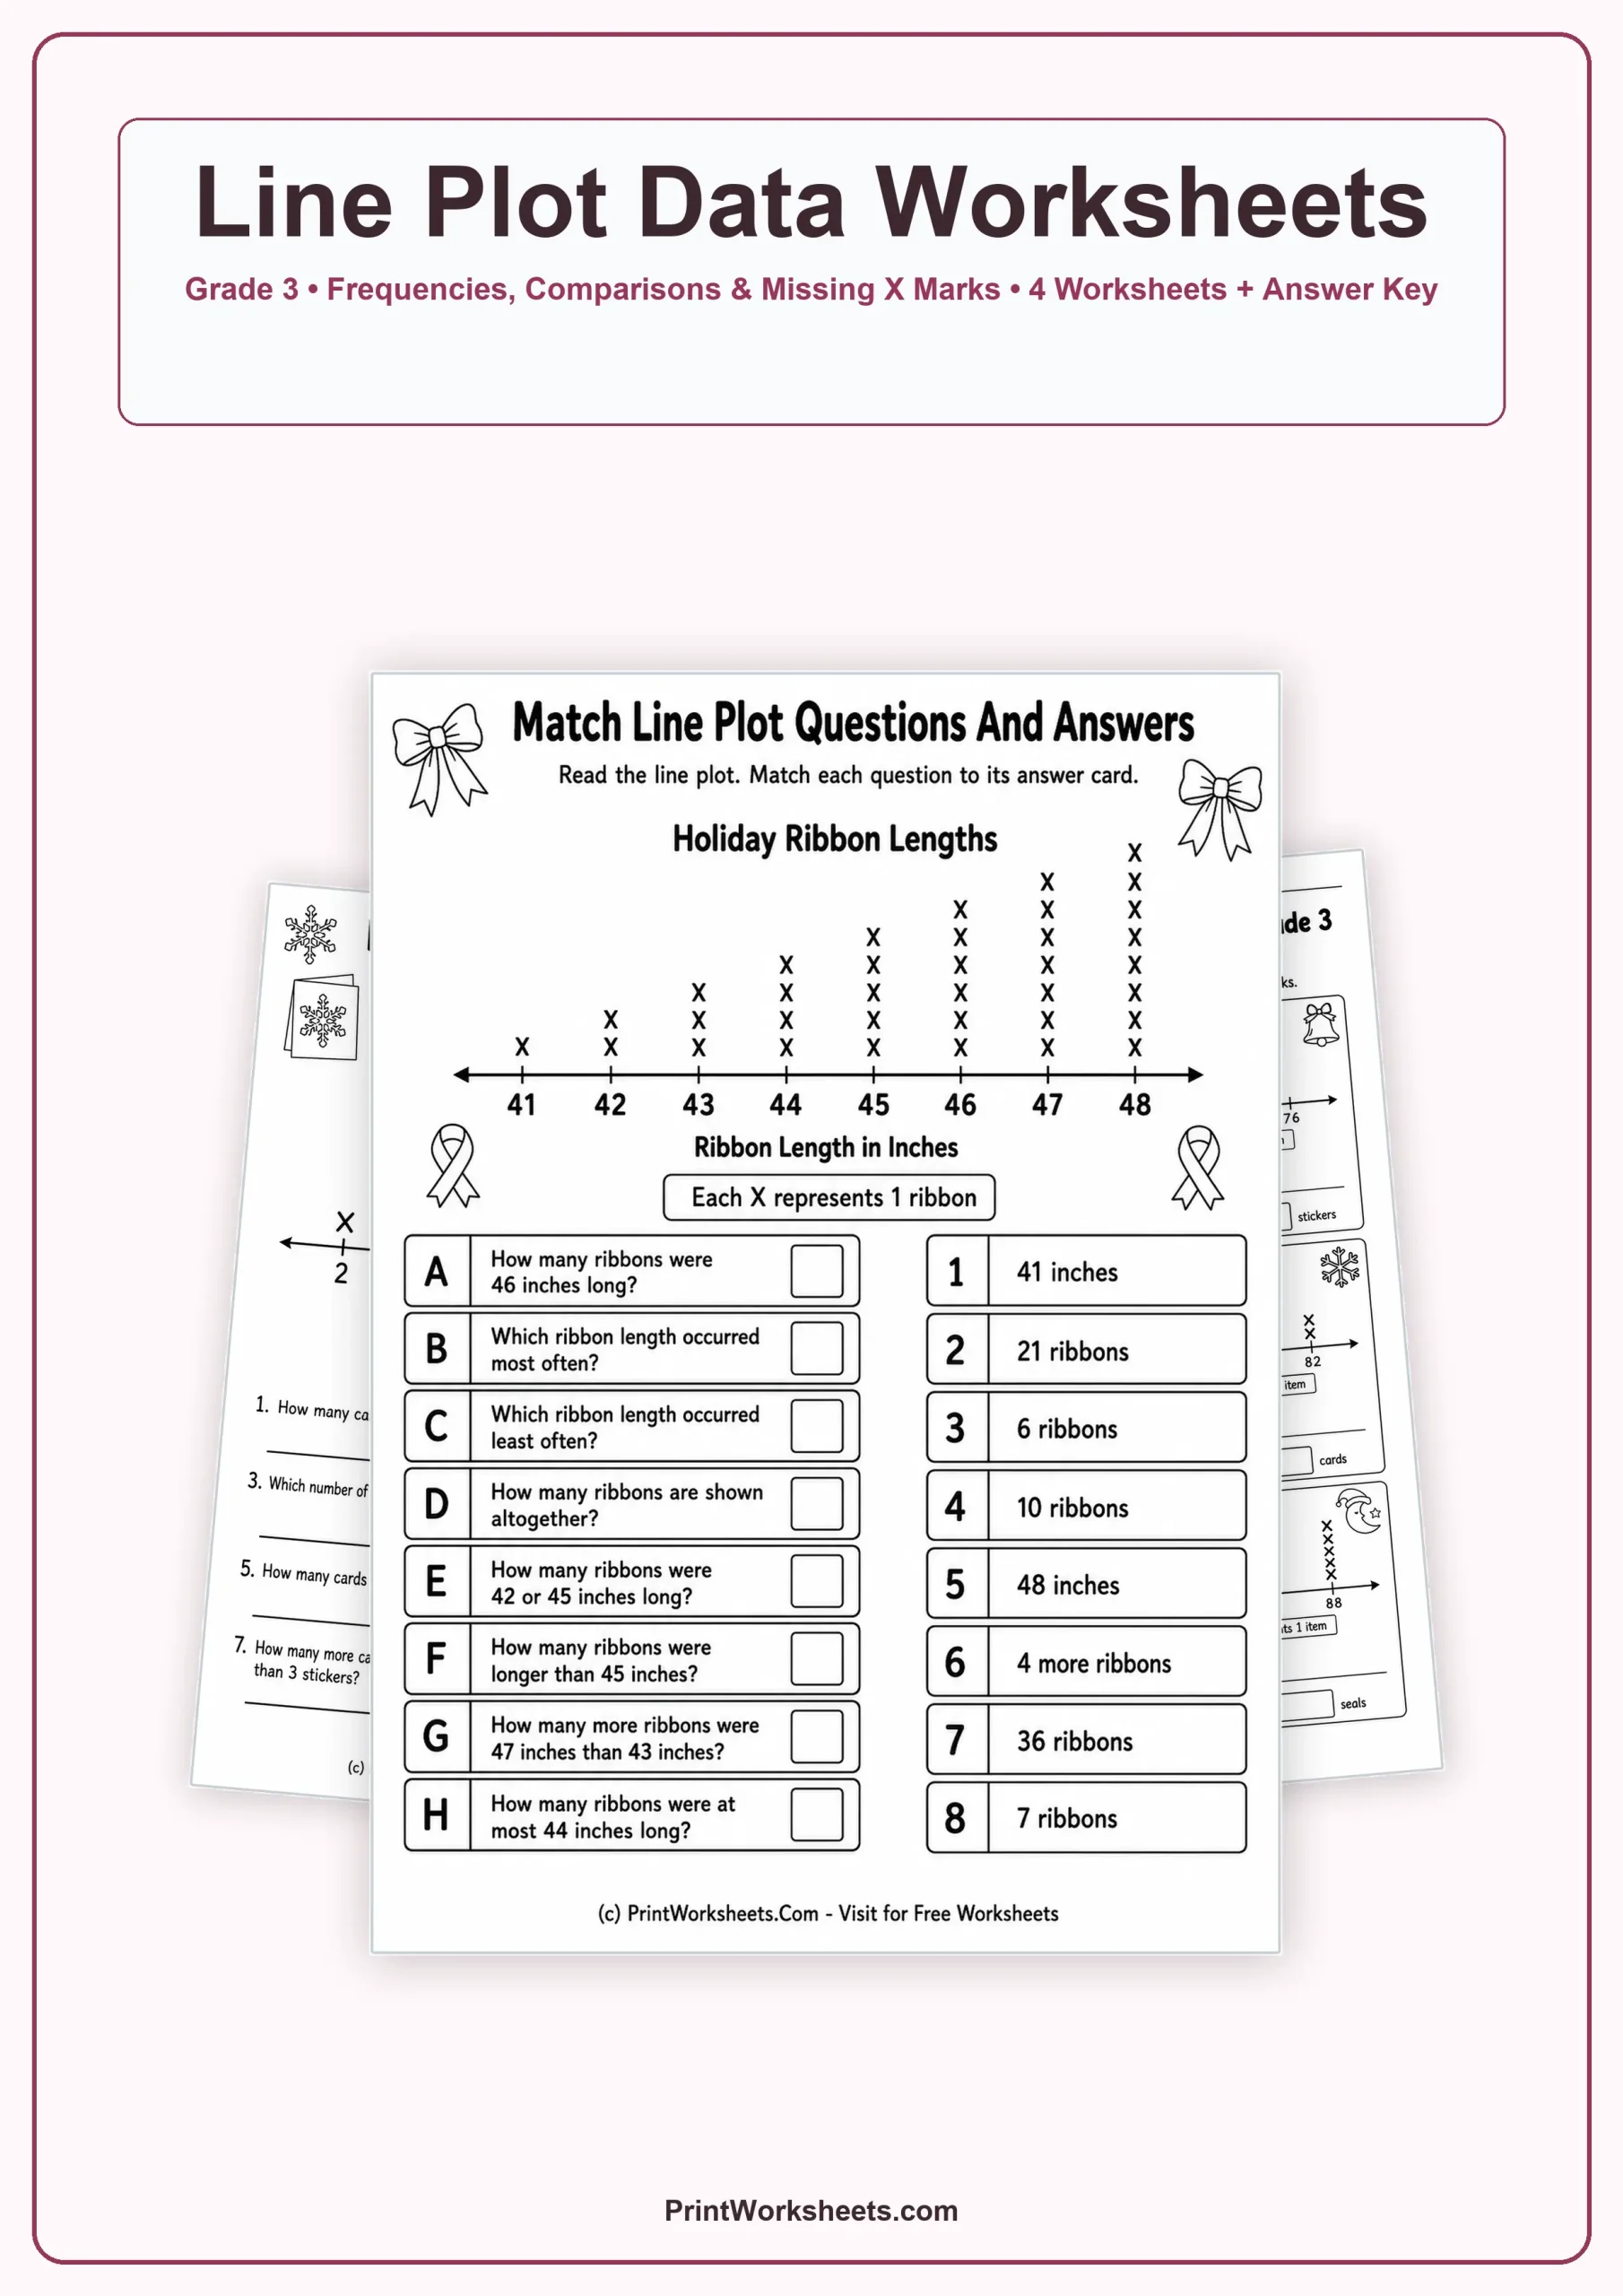
These line plot data worksheets give third graders several ways to read, compare, and reason about data shown with X marks. Instead of repeating one question format, the set moves from direct line plot interpretation to answer matching, missing-frequency problems, and short real-world stories. Students work with totals, differences, most and least common values, combined categories, and values above or below a stated amount. Four student worksheets are followed by an answer key, making the set practical for independent practice, math centers, homework, or a focused data lesson.
Grade 3 line plot data worksheets with varied question types
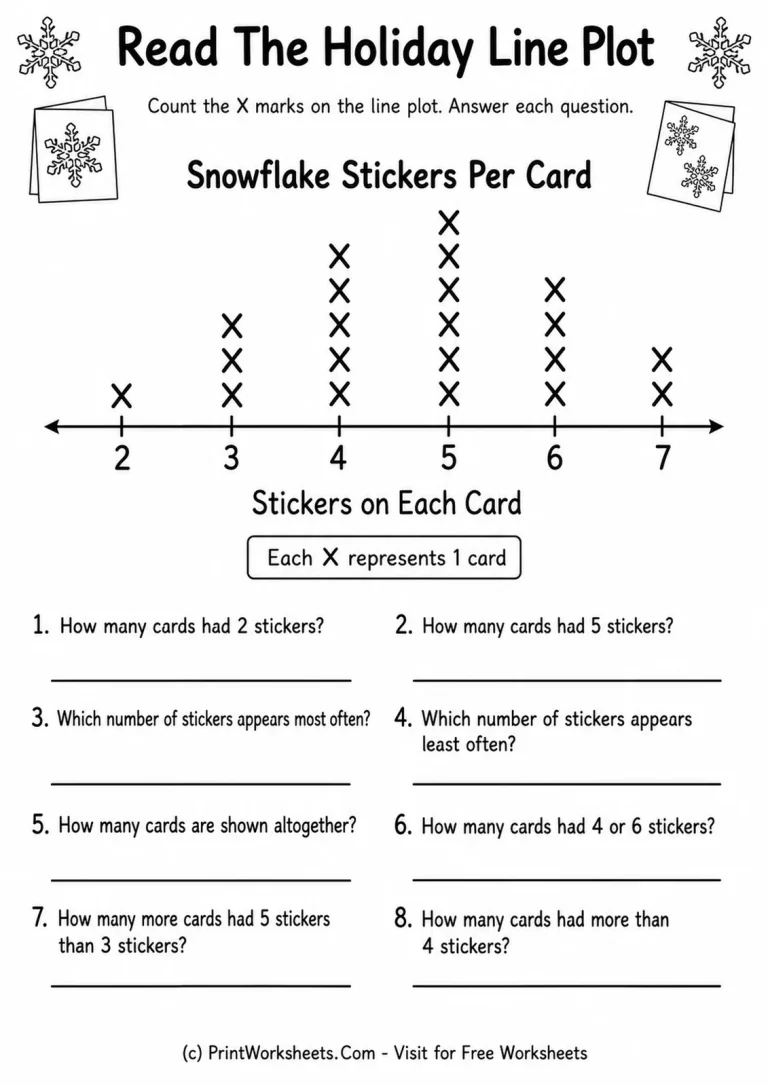
The first worksheet uses a Snowflake Stickers Per Card line plot. Each X represents one card, and students read frequencies for values from 2 through 7 stickers. The questions go beyond simply counting marks. Students identify how many cards have a particular number of stickers, determine which value occurs most and least often, calculate the total number of cards, combine two categories, compare frequencies, and find how many cards have more than four stickers. This gives students repeated practice turning a visual data display into numerical statements.
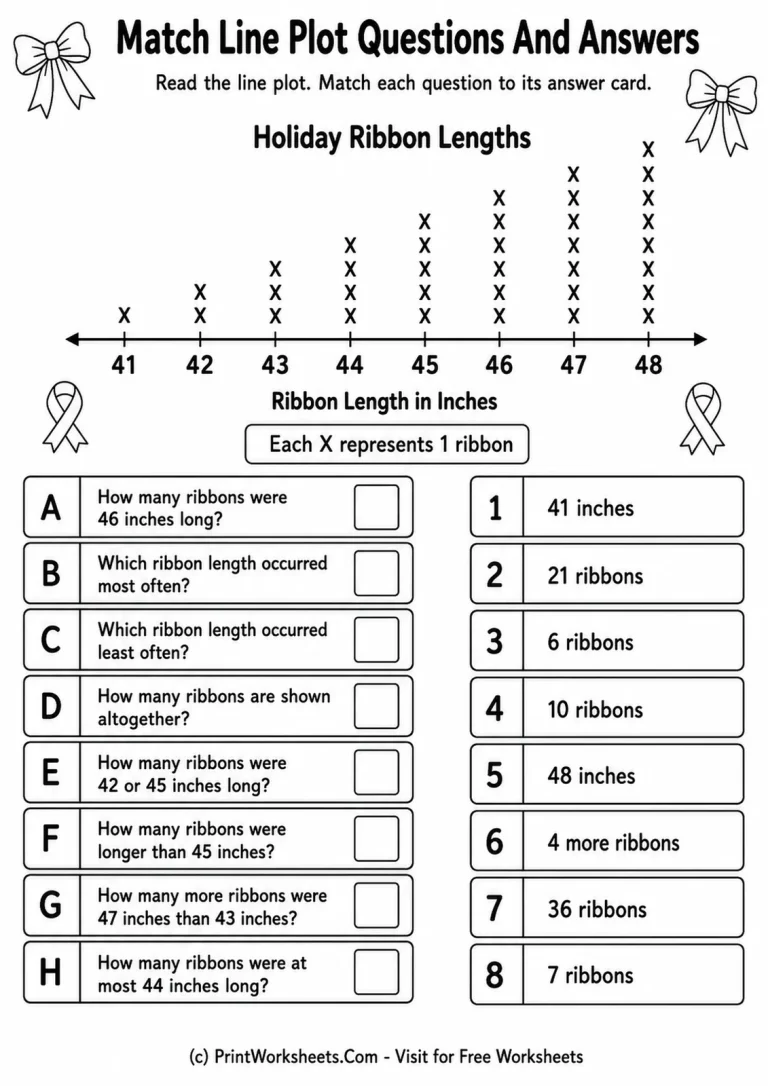
The second worksheet changes the format by asking students to match questions with answer cards. A Holiday Ribbon Lengths line plot shows ribbon measurements from 41 to 48 inches. Students determine exact frequencies, identify the most and least frequent ribbon lengths, find the total number of ribbons, combine selected lengths, compare two frequencies, and calculate how many ribbons fall within a stated range. Because the answers appear separately as numbered cards, students must solve each prompt before deciding which match is correct.
Finding missing frequencies from a known total
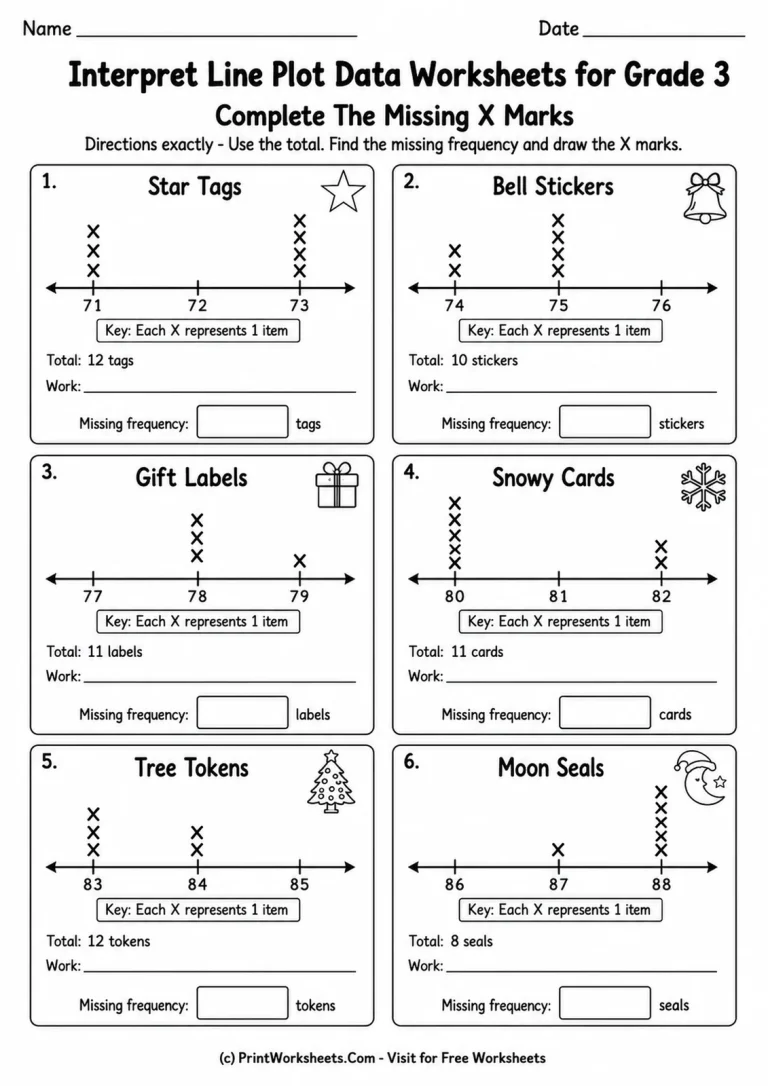
The third activity introduces a useful inverse-thinking skill. Six small line plots show partial data for Star Tags, Bell Stickers, Gift Labels, Snowy Cards, Tree Tokens, and Moon Seals. Each problem provides a total number of items, while one position on the line plot is missing its X marks. Students count the visible marks, subtract from the stated total, record the missing frequency, and then draw the missing X marks. The required missing frequencies vary across the page, so students cannot rely on a repeating pattern.
This page is especially useful for connecting line plots with addition and subtraction. Rather than only reading data that is already complete, students reconstruct part of the data set from the information provided. Teachers who want to reinforce earlier graph-reading skills can also pair this work with tally chart data questions worksheets for Grade 2, where students practice extracting information from another frequency-based display.
Line plot story problems in meaningful contexts
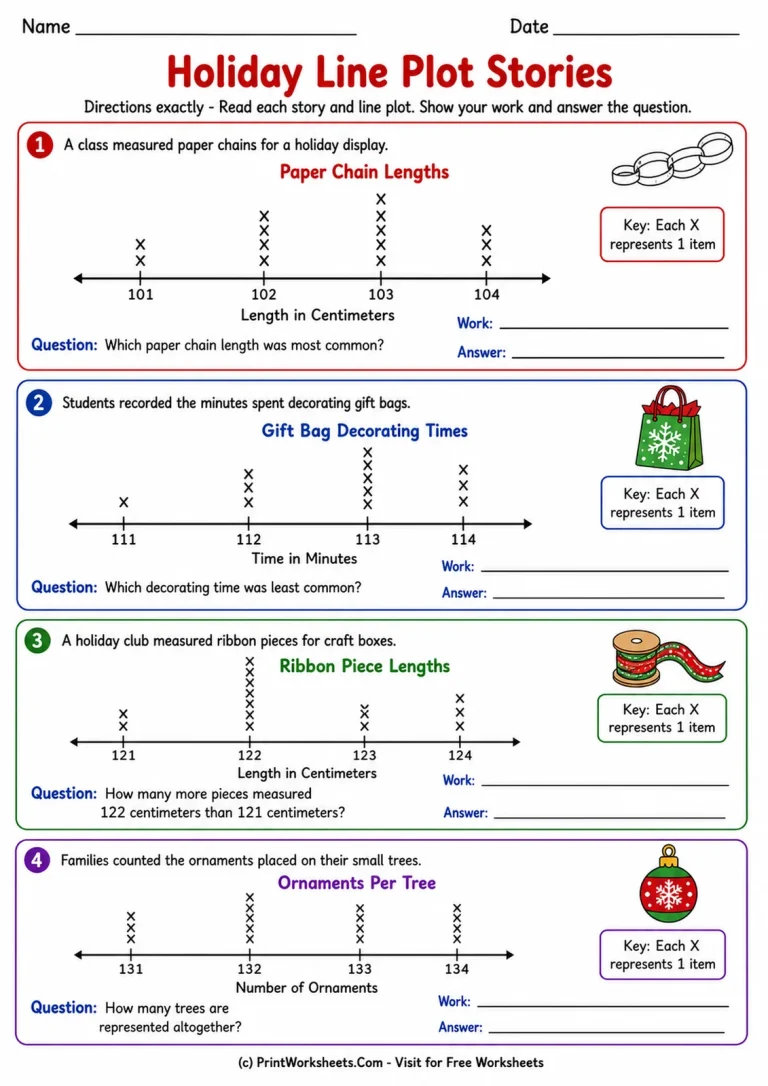
The fourth worksheet places line plots inside short holiday-themed situations. Students read data about paper chain lengths, gift bag decorating times, ribbon piece lengths, and ornaments per tree. One question asks for the most common paper chain length, another asks for the least common decorating time, another requires finding how many more ribbon pieces appear at one measurement than another, and the final problem asks for the total number of trees represented. Centimeters, minutes, and item counts help students pay attention to units as well as frequencies.
These story problems make a useful bridge between reading a graph and explaining what the graph means in context. For students who need additional comparison practice with visual data, compare data in picture graphs worksheets for Grade 2 provide a simpler visual-data format. Older students ready for a different type of data display can progress to line graphs with decimal data worksheets for Grade 5.
Skills practiced across the worksheet set
Across the four student pages, learners count X marks, interpret one-mark-per-item keys, identify modes and least frequent values, calculate totals, combine frequencies, compare categories, reason about greater-than and at-most conditions, and determine missing frequencies from a known total. They also encounter line plots labeled with stickers, inches, centimeters, minutes, and object counts, helping them see that the same data-reading strategy can be applied to different contexts.
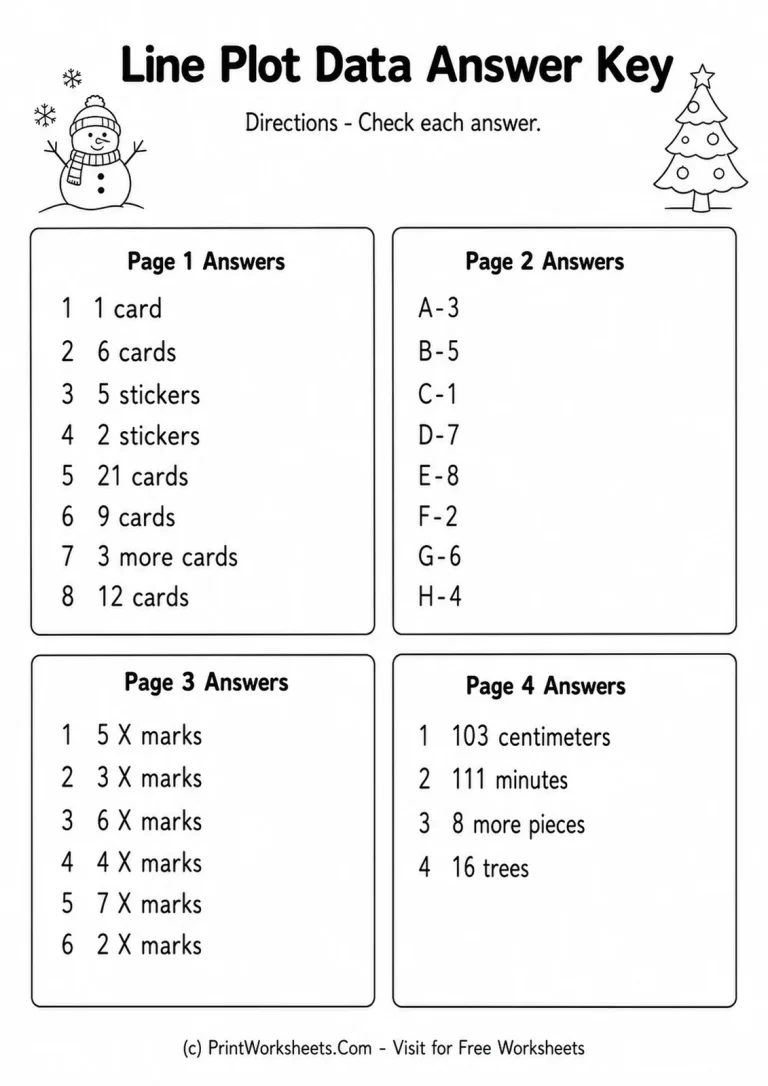
The included answer key covers all four activities, so checking work is straightforward. Use the pages in sequence for a short line plot unit, assign individual sheets for targeted practice, or select the missing-frequency and story-problem pages when students are ready for more reasoning than simple frequency counting.