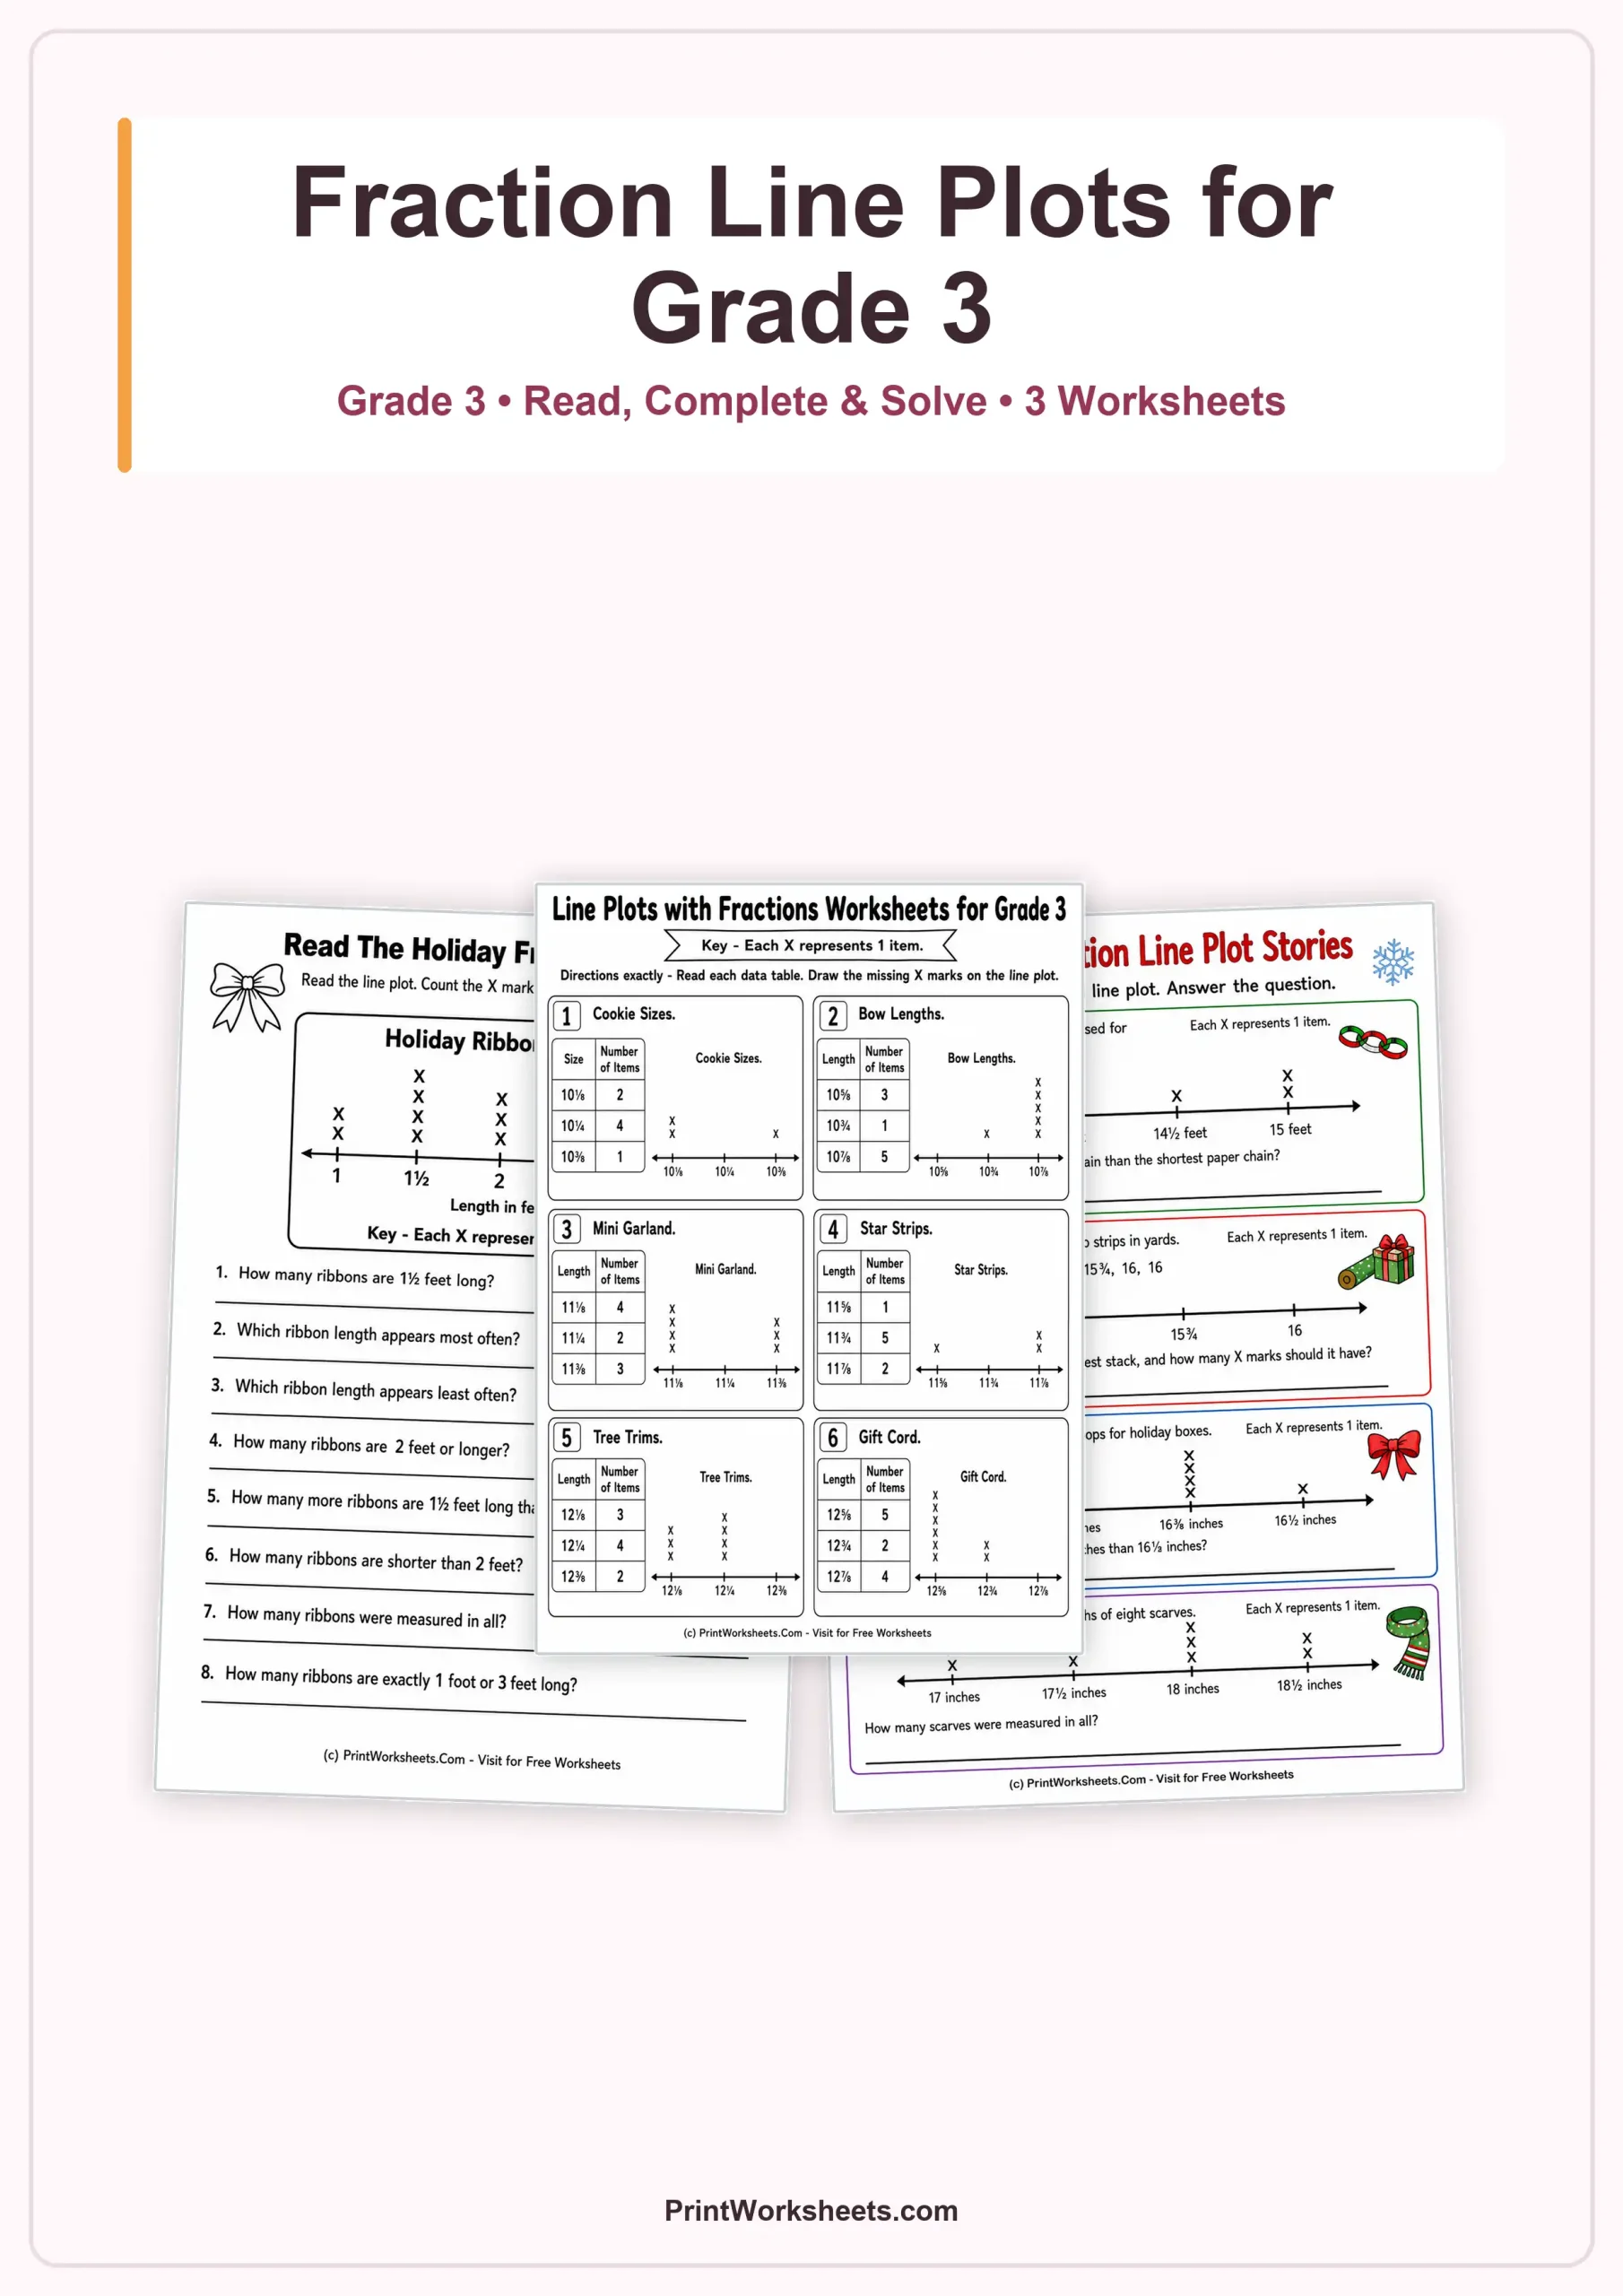
Fraction line plots become much easier to understand when students can connect every X mark to a real measurement. These Grade 3 fraction line plots worksheets use ribbon lengths, cookie sizes, garland pieces, paper chains, gift-wrap strips, ribbon loops, and scarves to turn fractional data into clear visual questions. Across three printable student pages, children read completed plots, finish plots from tables, and solve short measurement stories using halves, quarters, and eighths.
What students practice with fraction line plots
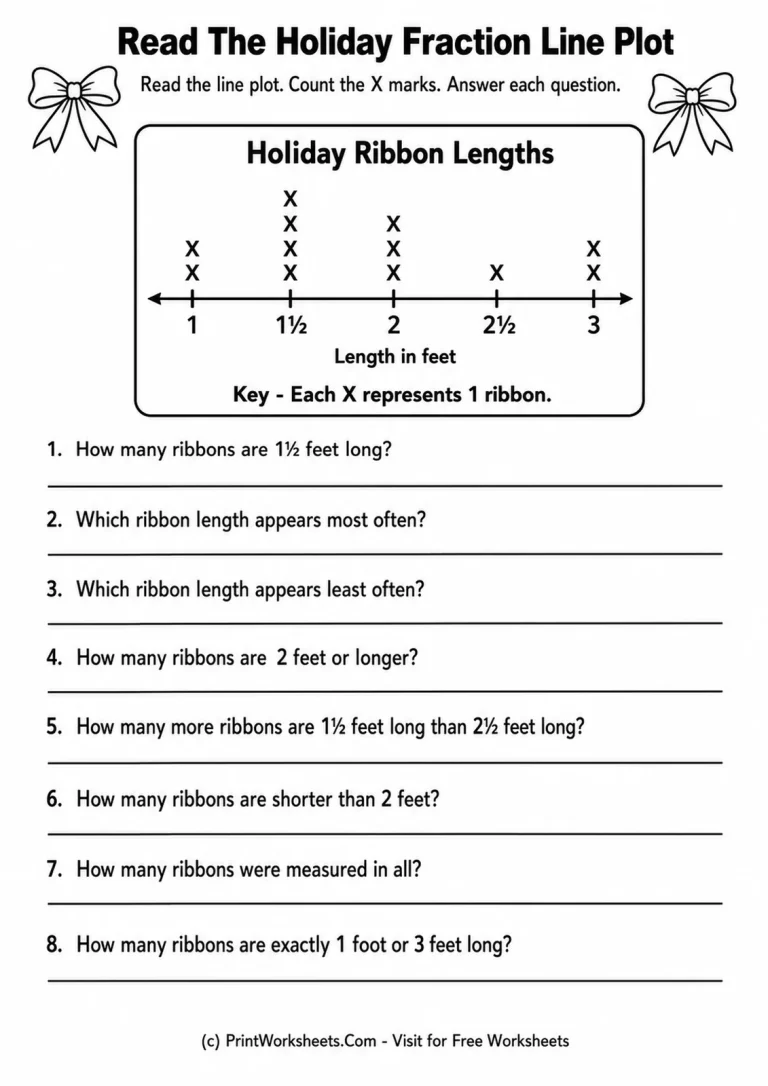
The first worksheet focuses on reading a completed line plot titled Holiday Ribbon Lengths. Measurements run from 1 foot to 3 feet in half-foot steps, and each X represents one ribbon. Students count how many ribbons are 1½ feet long, identify the most and least frequent lengths, combine frequencies for lengths of 2 feet or longer, compare two categories, and find the total number of ribbons measured. This page is useful for checking whether students understand that the height of an X stack represents frequency rather than measurement size.
The questions also ask students to reason across more than one position on the plot. For example, they must combine the counts below 2 feet and combine the counts at exactly 1 foot or 3 feet. That makes the activity more than simple counting: students have to interpret the labels, locate the relevant values, and decide which X marks belong in each answer.
Build line plots from fractional data tables
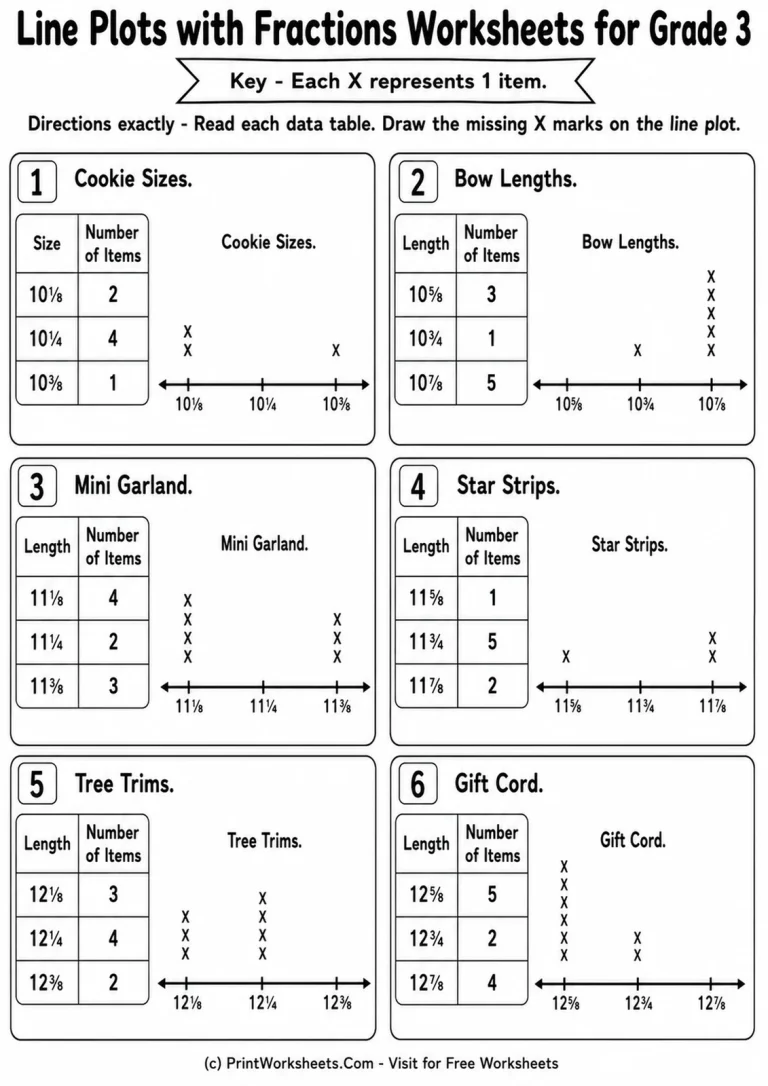
Another worksheet reverses the process. Six mini activities show a data table beside a partly completed line plot. Students compare the stated number of items with the X marks already shown and draw only the missing marks. The measurement sets include Cookie Sizes, Bow Lengths, Mini Garland, Star Strips, Tree Trims, and Gift Cord.
This page extends the fraction work beyond halves and quarters. Students see mixed-number measurements such as 10⅛, 10¼, 10⅜, 10⅝, 10¾, 10⅞, 11⅛, 11¼, 11⅜, 11⅝, 11¾, 11⅞, 12⅛, 12¼, 12⅜, 12⅝, 12¾, and 12⅞. Because each table gives an exact frequency, every missing stack can be completed by comparing the table count with the marks already present. The task reinforces careful one-to-one correspondence between a frequency table and a line plot.
Holiday measurement stories add problem solving
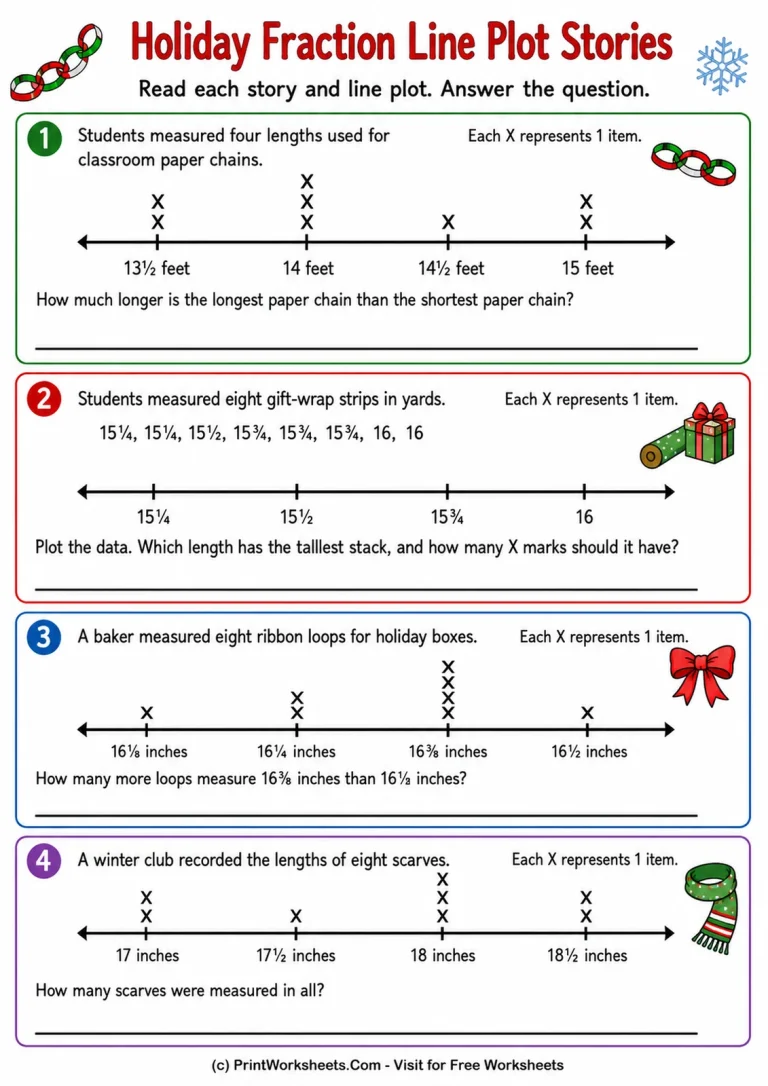
The third approved worksheet places line plots inside four short holiday-themed measurement situations. One problem asks students to compare the longest and shortest classroom paper-chain lengths. Another provides eight gift-wrap measurements and asks students to plot the data, identify the tallest stack, and state how many X marks it should contain. A ribbon-loop problem asks for the difference between two frequencies, while a scarf problem asks students to total every X on the plot.
These story problems help students move between three forms of representation: written measurement data, X-mark line plots, and numerical answers. Units also vary naturally across the page. Paper chains use feet, gift-wrap strips use yards, and ribbon loops and scarves use inches. This makes students pay attention to both the fractional value and the stated unit instead of reading the graph mechanically.
Ways to use these Grade 3 worksheets
The three pages can be used in different parts of a lesson. Start with the Holiday Ribbon Lengths page when students need practice reading an already completed plot. Use the data-table page when the goal is constructing or completing line plots accurately. Save the story page for independent practice, a small-group challenge, or a quick check of whether students can apply line-plot reasoning in context.
For related practice at an easier measurement level, the Grade 2 whole-number line plot worksheets focus on line plots without fractional measurements. Students who are ready for a later-grade extension can continue with Grade 4 line plots with fraction measurements. For another Grade 3 data-display format, see the scaled bar graph worksheets for Grade 3.
Use one page at a time or combine all three to see whether students can read, complete, compare, and reason from fractional line-plot data. The changing task types make the set especially useful for distinguishing students who can count X marks from students who can truly interpret fractional measurement data.