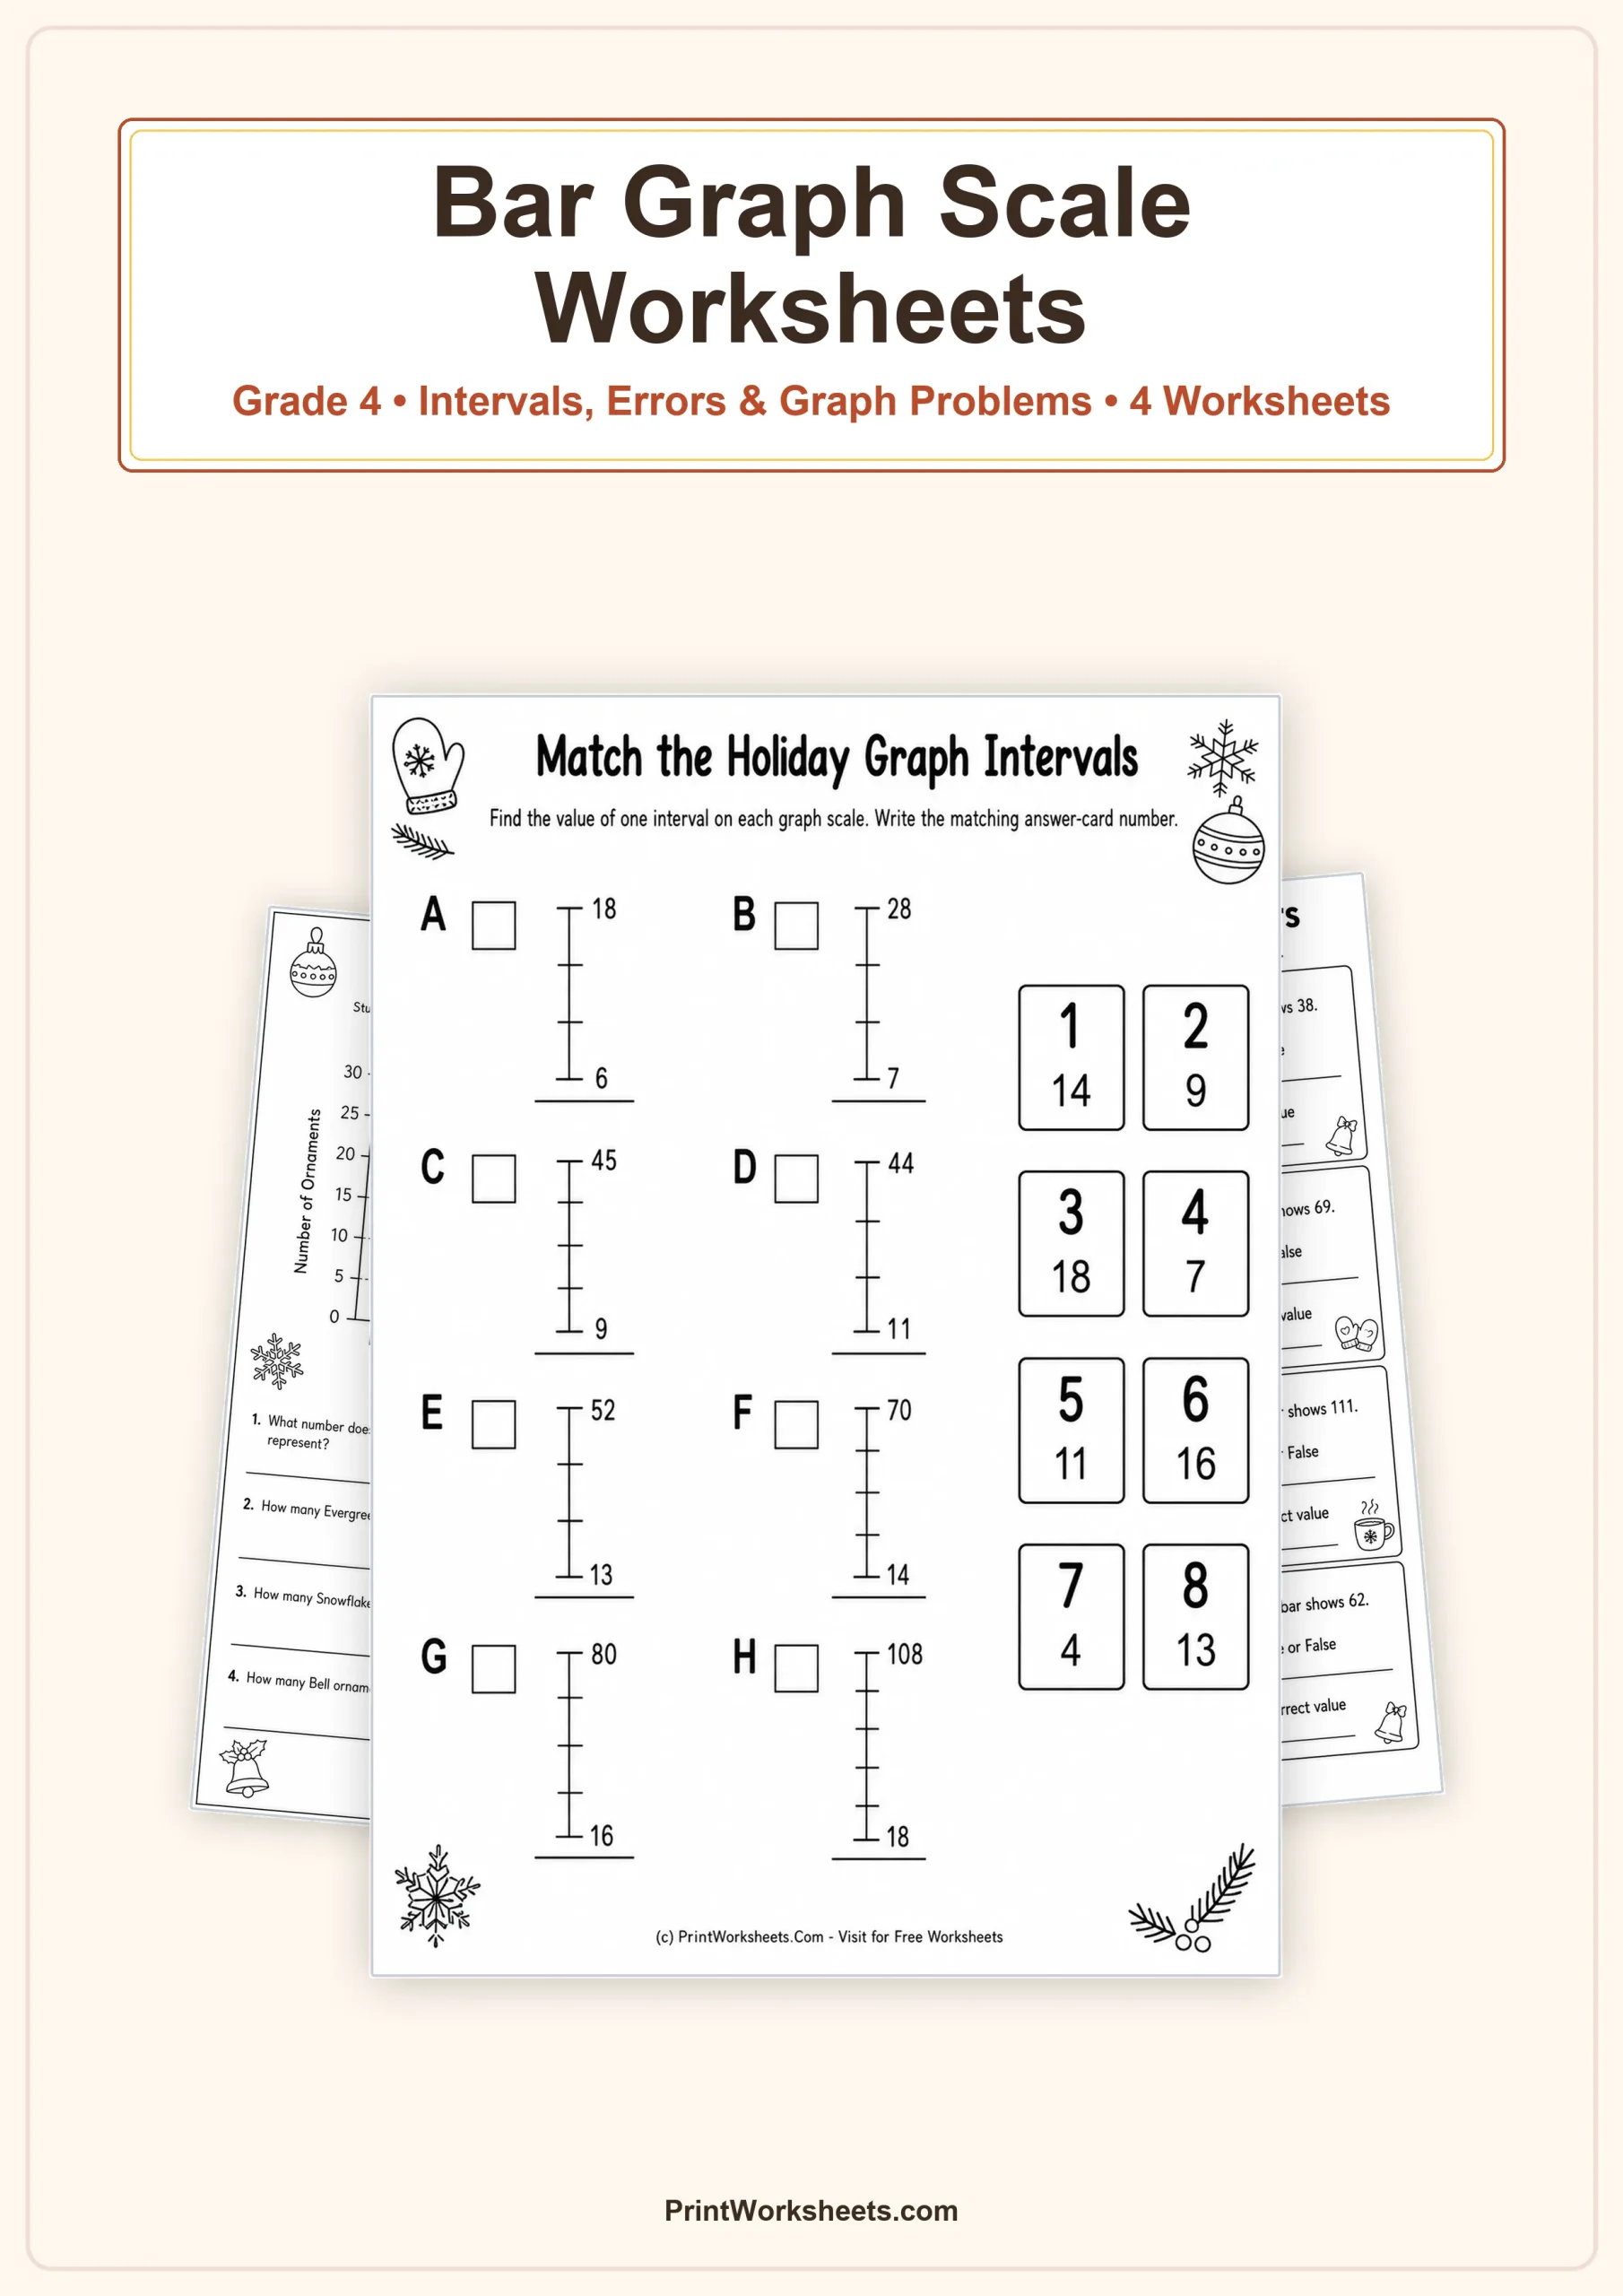
These bar graph scale worksheets give fourth graders several different ways to examine how a graph scale works instead of simply reading one bar and writing a number. Across the set, students identify interval values, compare bar heights, correct inaccurate graph statements, complete a missing scale label, and use scaled graphs in short holiday and winter story problems. The numbers move from an accessible 0–30 graph into scales involving values above 200, so the practice gradually asks for more careful numerical reasoning.
What these bar graph scale worksheets practice
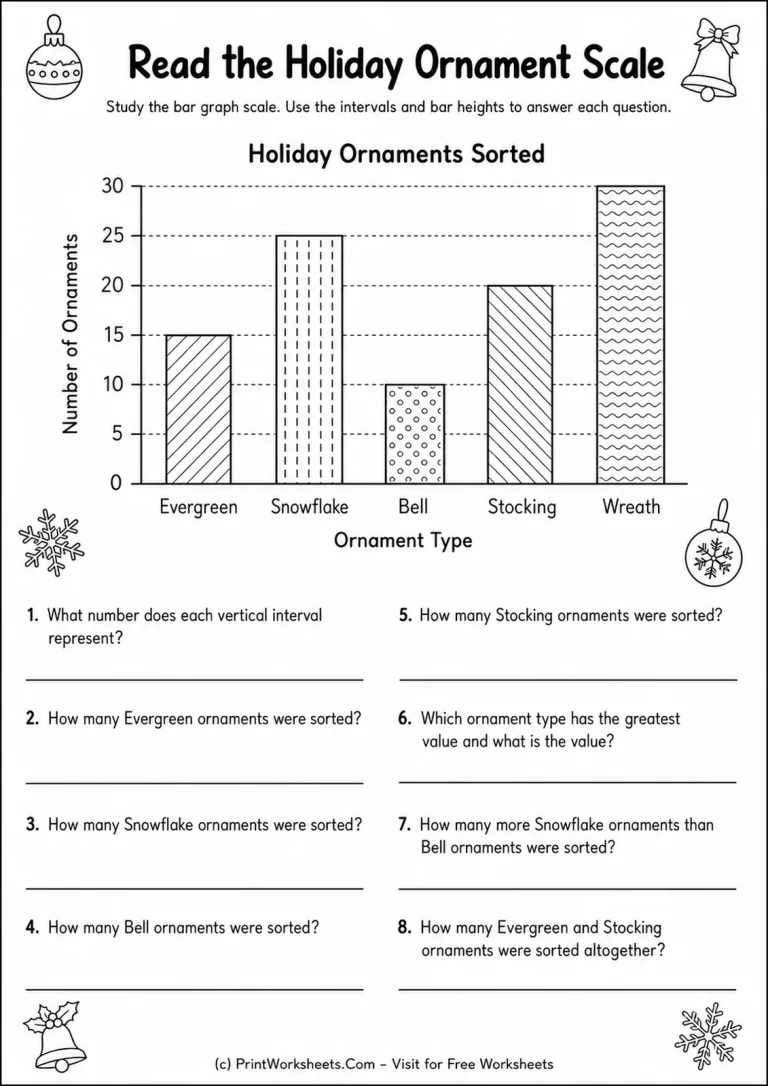
The first worksheet uses a holiday ornament bar graph with a vertical scale from 0 to 30 in intervals of 5. Five categories—Evergreen, Snowflake, Bell, Stocking, and Wreath—have bars at 15, 25, 10, 20, and 30. Students first identify what one interval represents and then read individual bar values. Later questions ask them to find the greatest value, compare Snowflake and Bell ornaments, and combine Evergreen and Stocking totals. This page connects scale reading directly to comparison and addition without changing the visual representation.
Finding interval values from labeled scales
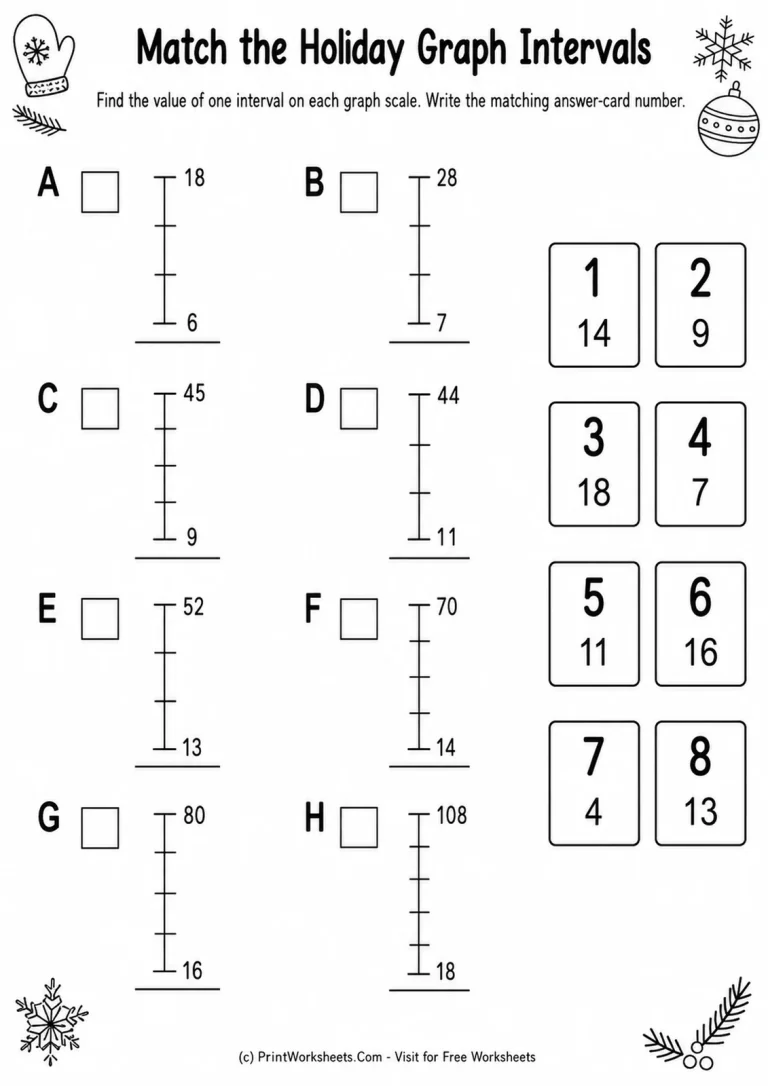
The second activity removes full bar graphs and focuses attention directly on the scale itself. Eight vertical scales labeled A through H show top and bottom values with evenly spaced ticks. Students determine the value of one interval and match each scale to an answer card. The correct interval values include 4, 7, 9, 11, 13, 14, 16, and 18. Because the endpoints and increments change from problem to problem, students cannot rely on one repeated counting pattern. They must notice the total change and the number of equal spaces on each scale.
Checking whether a bar value is reasonable
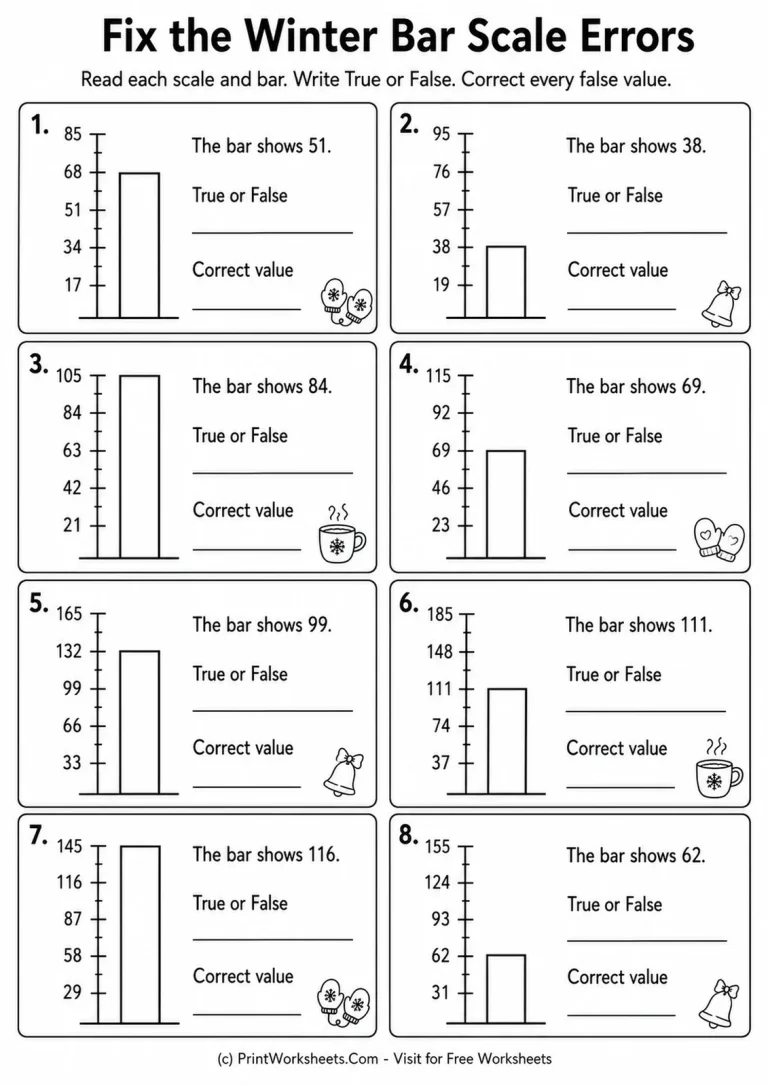
The third worksheet turns scale reading into an error-analysis task. Each of eight mini graphs includes a bar, a numbered vertical scale, and a statement such as “The bar shows 51.” Students decide whether the statement is True or False and correct each false value. For example, one graph is marked in steps of 17 and has a bar at 68 even though the printed claim says 51. Other scales use increments such as 19, 21, 23, 33, 37, 29, and 31. Some statements are already correct, so students must actually read the graph rather than assuming every item contains an error.
Applying scale reasoning to Grade 4 graph stories
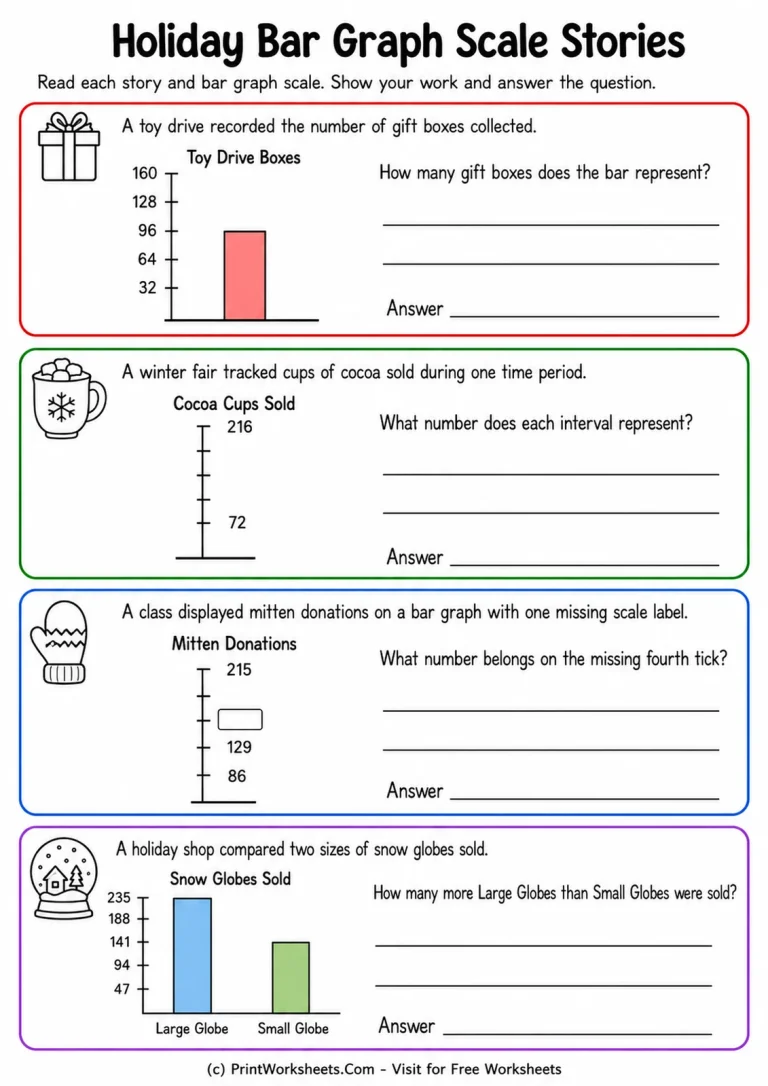
The final worksheet places the same skill into four short seasonal situations. A Toy Drive Boxes graph asks students to read a bar at 96 from a scale marked 32, 64, 96, 128, and 160. A Cocoa Cups Sold scale gives 72 and 216 and asks for the value of each interval, leading students to determine an interval of 36. A Mitten Donations graph includes a missing fourth tick between visible values 129 and 215, requiring students to continue the 43-count pattern and write 172.
The Snow Globes Sold problem adds a comparison step. The Large Globe bar reaches 235 while the Small Globe bar reaches 141 on a scale increasing by 47. Students read both values and subtract to determine that 94 more large globes were sold. This combination of graph interpretation and arithmetic makes the page useful for students who can read a scale but still need practice using the information they extract.
Ways to use the four-page set
The pages can be used in sequence or selected by skill. The ornament graph works well for initial independent practice because every major tick is labeled and the interval is consistent and familiar. The matching page isolates interval calculation for students who need more focused work on scale structure. The True/False page is especially useful for checking whether students can detect common bar-reading mistakes. The story page can then serve as an application task after students are comfortable identifying increments.
For classroom review, teachers can ask students to explain how they found one interval before allowing them to solve the remaining items independently. Parents can use the same strategy at home: have the child name two labeled values, count the spaces between them, and explain the size of each step. The goal is not just to reach the correct number, but to understand why equally spaced ticks must represent equal numerical intervals. These printable Grade 4 pages provide repeated practice with that idea while varying the graph format, number size, and type of question.
Check more graphing data worksheets pdf free.