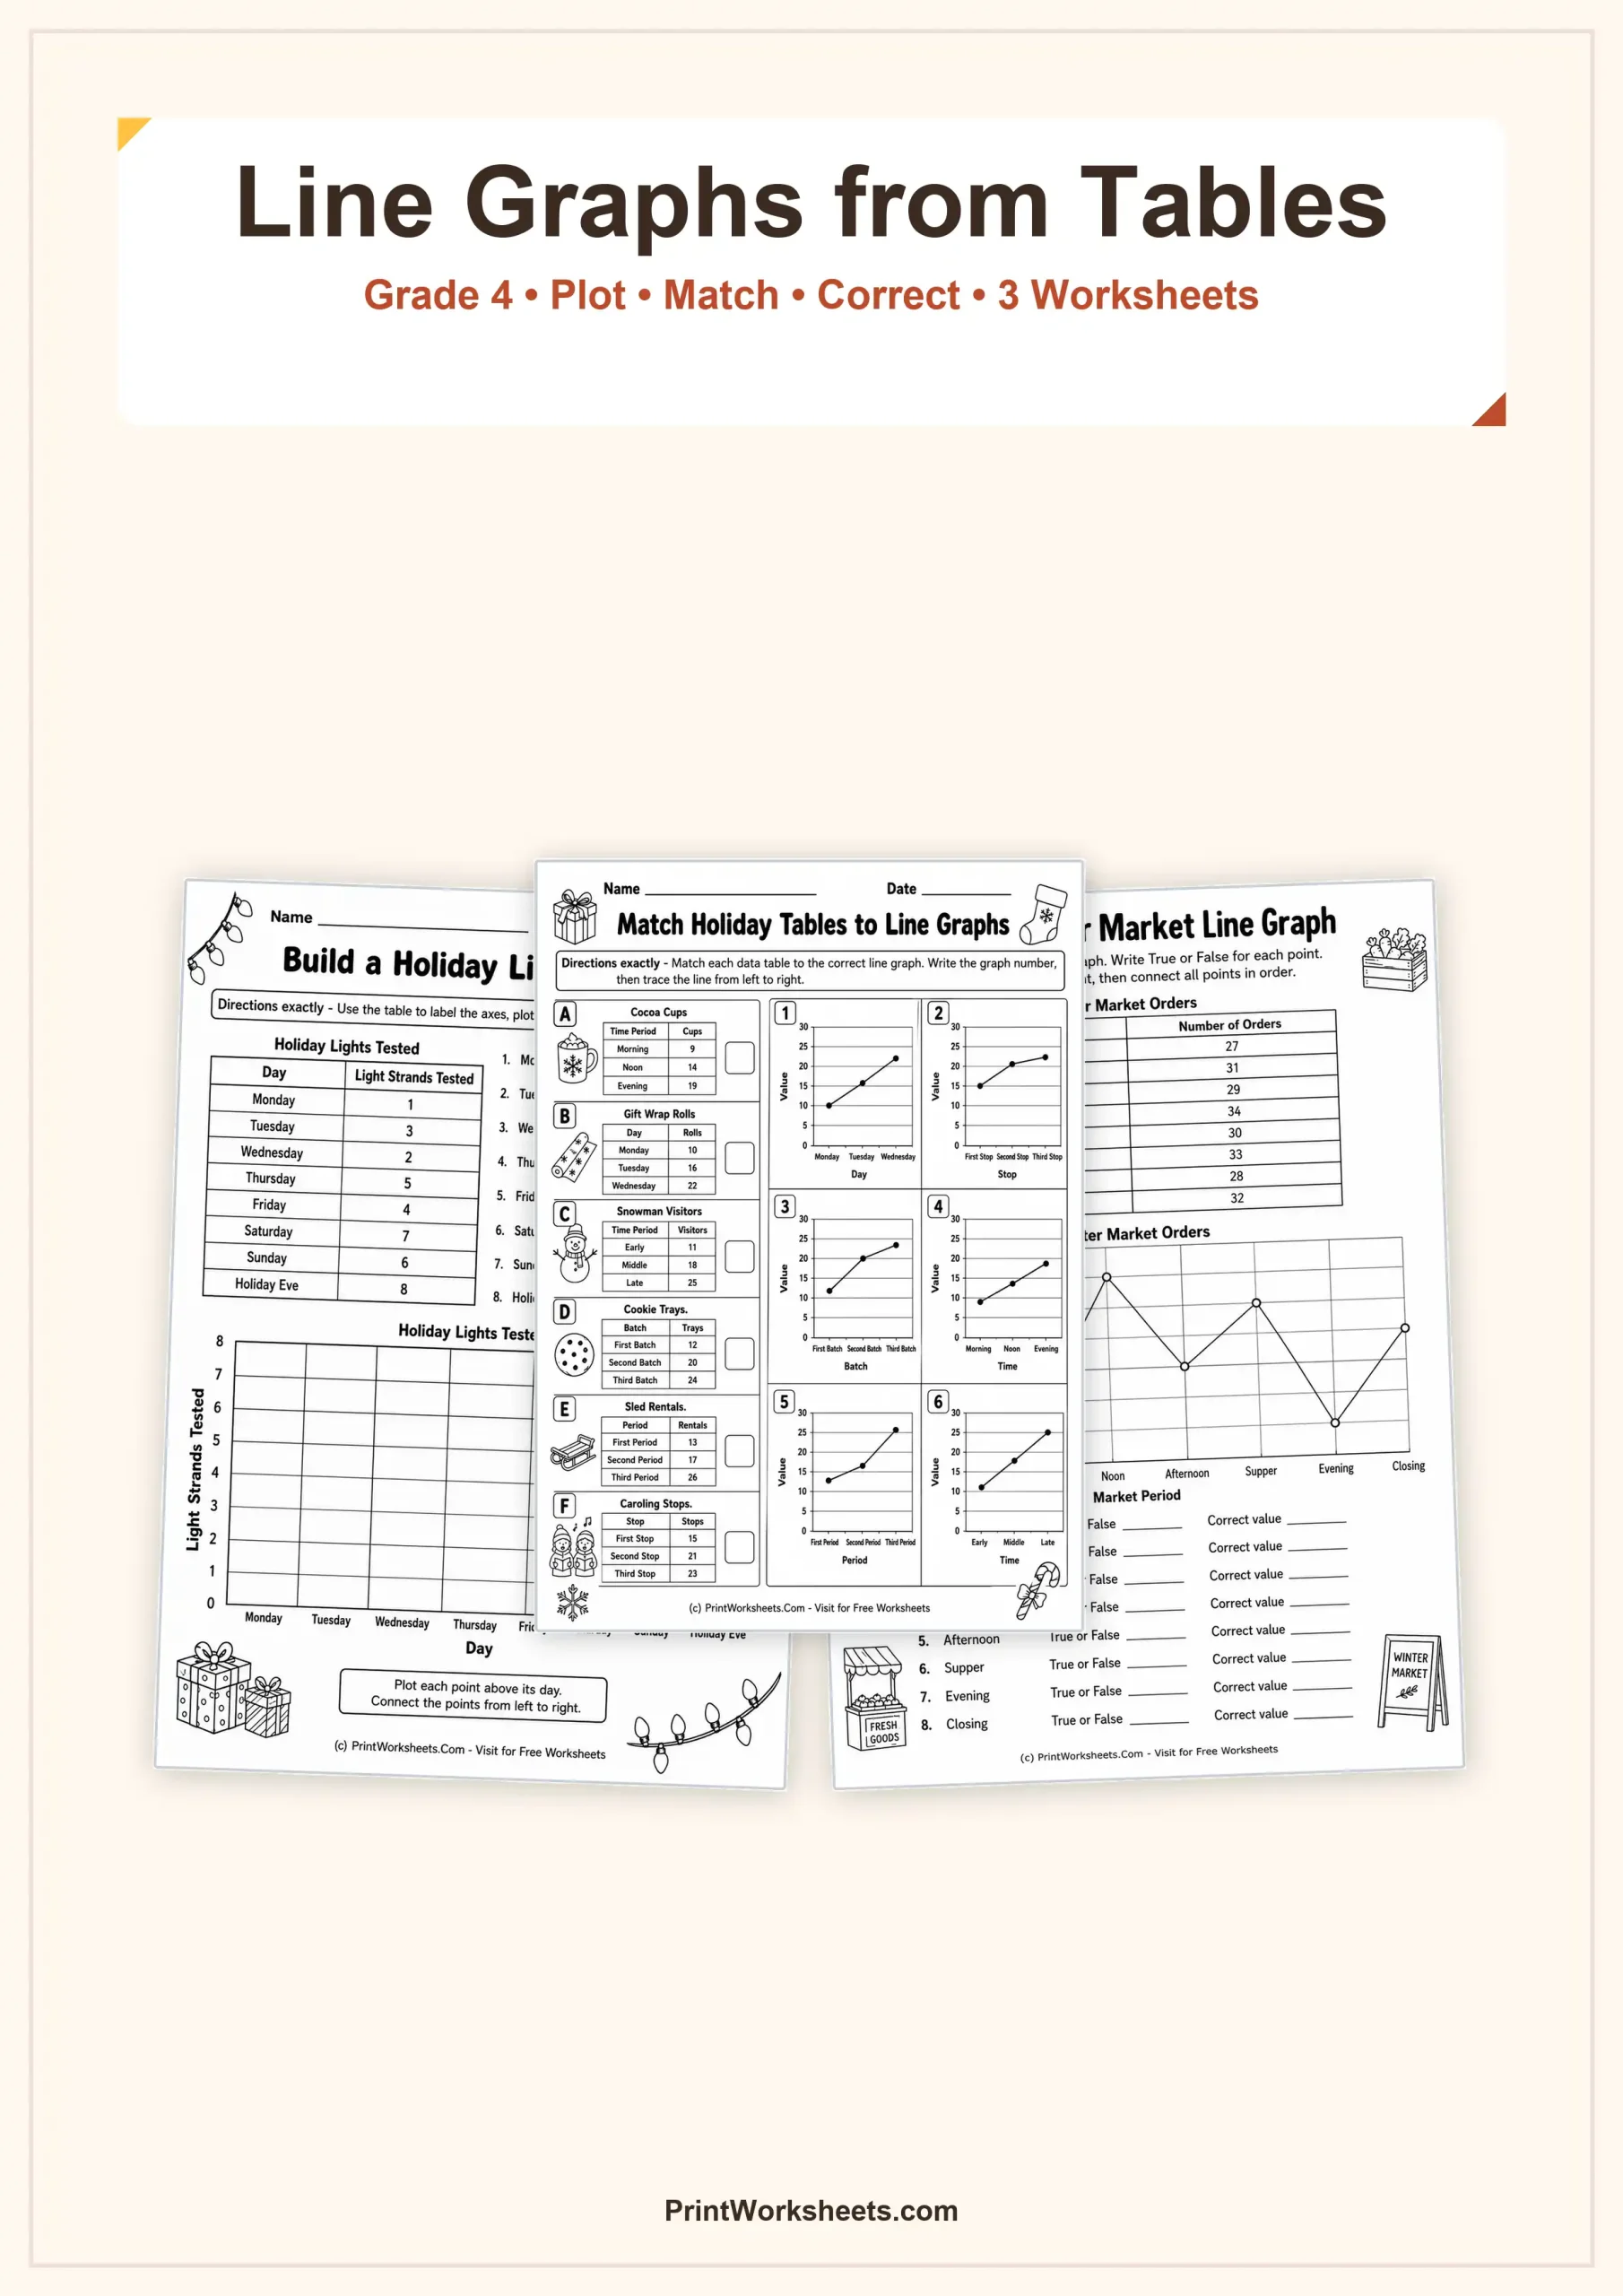
These Grade 4 worksheets help students make line graphs from organized tables instead of only answering questions about graphs that are already complete. Across three activities, children plot values from a table, connect table patterns to finished graphs, and check whether individual points were plotted correctly. The set is especially useful when students are ready to move from reading line graphs to producing and validating them on their own.
Make Line Graphs from Tables Step by Step
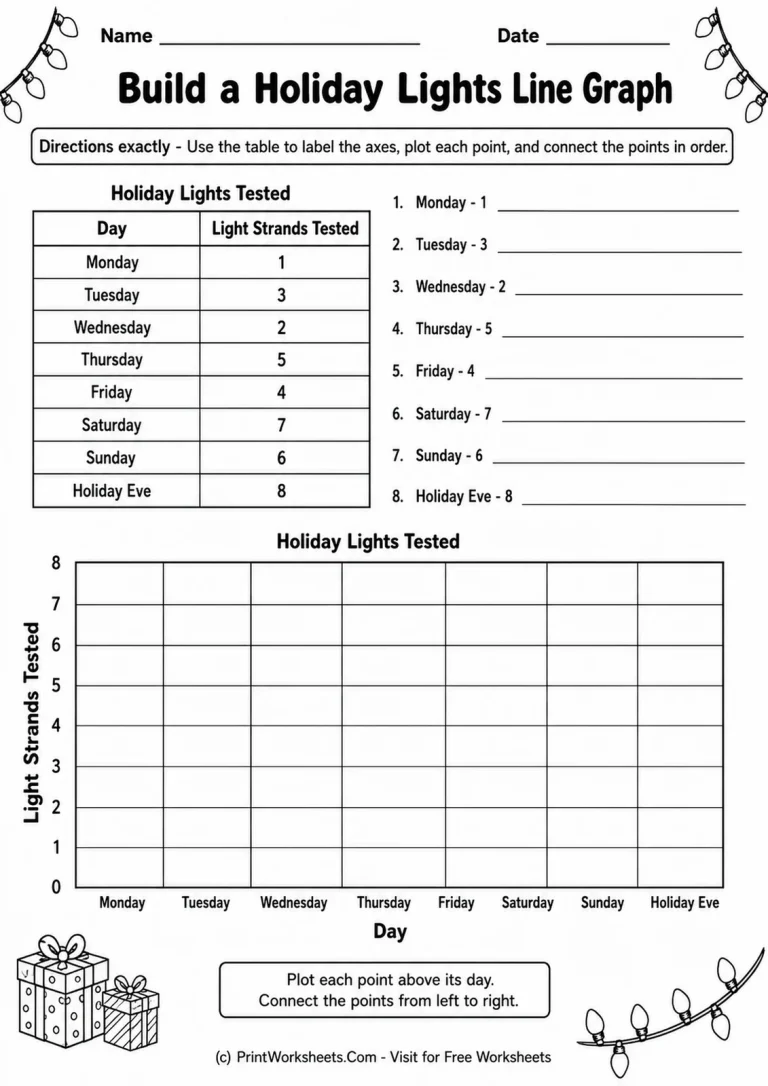
The first worksheet, Build a Holiday Lights Line Graph, gives students an eight-row table showing light strands tested from Monday through Holiday Eve. Students transfer each value to a blank coordinate grid, using the day categories along the horizontal axis and a vertical scale from 0 to 8. Because the scale is already established, the main challenge is accurately locating each value, keeping the points in the correct sequence, and connecting them to form the line graph.
This activity works well as an introduction to table-to-graph conversion because students can focus on the relationship between each table entry and its plotted point. Teachers can also use it to check whether a student understands that every row in a table corresponds to one location on the graph. For additional practice with another graph-building format, the Create Bar Graphs from Tables Worksheets provide a useful comparison between representing table data with bars and representing ordered data with connected points.
Match Data Tables to Completed Line Graphs
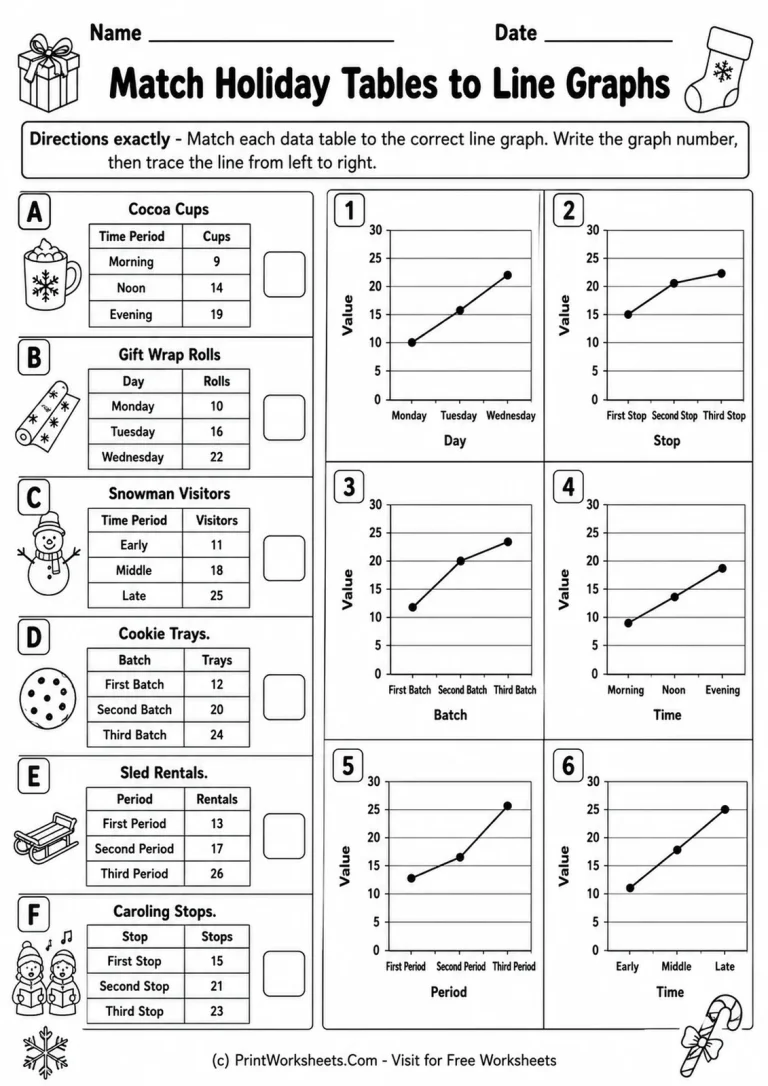
The second worksheet changes the reasoning task. Instead of constructing one graph, students compare six holiday-themed data tables labeled A through F with six completed line graphs numbered 1 through 6. The tables use different contexts, including cocoa cups, gift wrap rolls, snowman visitors, cookie trays, sled rentals, and caroling stops.
To make a correct match, students need to notice more than a single high or low value. They must compare the overall sequence of the data: where the line rises, where it falls, and how the values change from one category to the next. This makes the page a strong bridge between graph construction and graph interpretation. A student who can successfully match all six representations is showing that they understand how a table’s numerical pattern is preserved when it becomes a line graph.
Practice Scale Reading and Graph-Table Accuracy
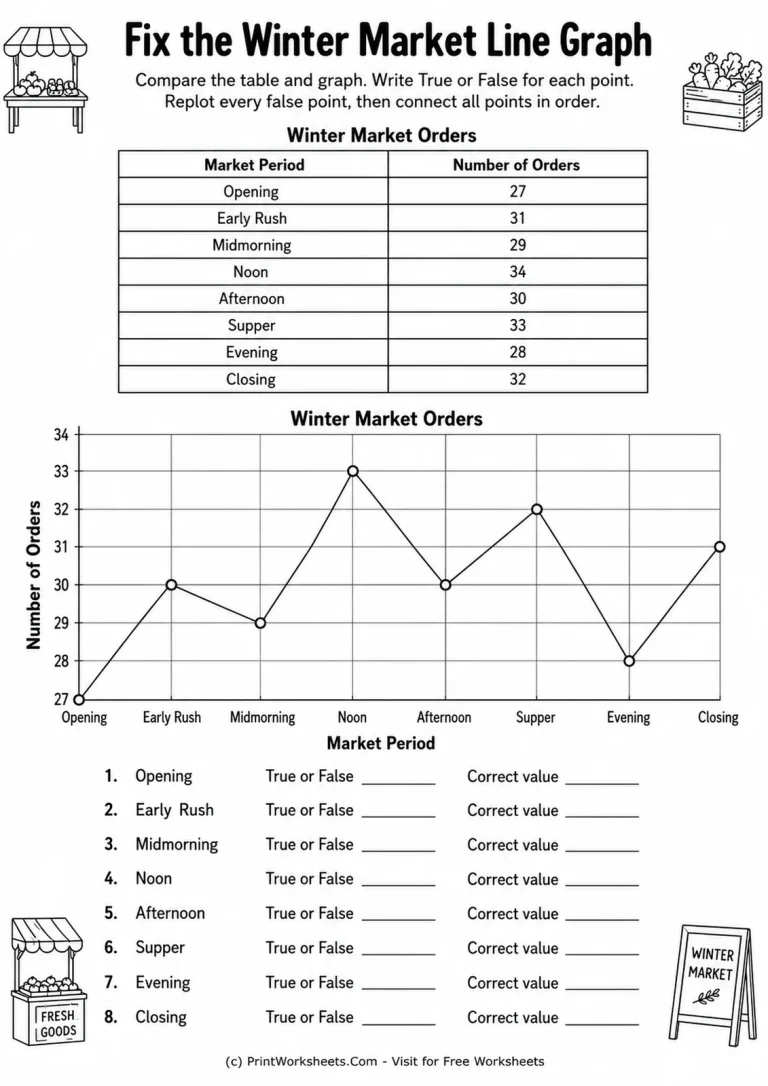
The third worksheet, Fix the Winter Market Line Graph, introduces error analysis. Students compare a Winter Market Orders table with an eight-point line graph whose vertical scale runs from 27 to 34. They decide whether each plotted point is True or False, write corrected values for points that do not match the table, and then replot the incorrect points.
This task asks for a deeper level of attention than simply drawing a graph from scratch. Students must move back and forth between the table, the numeric scale, and the plotted line. It can reveal common mistakes such as placing a point one interval too high or low, associating a value with the wrong category, or reading a compact scale too quickly. For a broader Grade 4 application of choosing and building displays from supplied information, see the Create Graphs from Real-World Data Worksheets for Grade 4.
Ways to Use These Grade 4 Line Graph Worksheets
The three pages can be taught as a short progression. Begin with the Holiday Lights page for direct modeling: read one table row, find the matching day on the horizontal axis, locate the value on the vertical axis, and plot the point. Next, use the matching worksheet to see whether students recognize the same relationships without being told which graph belongs to which table. Finish with the Winter Market page as a checking and correction activity.
The set also works well for centers, independent practice, homework, or a small-group review. A teacher can ask students to explain how they know a table matches a particular graph, or require them to describe exactly why a point is false before correcting it. Those short explanations make it easier to distinguish a genuine understanding of line graphs from guessing based on appearance.
Students who are ready for a more advanced extension can later work with Line Graphs with Decimal Data Worksheets for Grade 5, where the same graph-reading habits must be applied to more demanding numerical values.
Build Accuracy, Not Just Finished Graphs
What makes this set useful is the shift from creating a graph to recognizing one and then evaluating one for errors. Students practice plotting, sequence awareness, scale reading, comparison, and correction within the same skill family. By the end, they are not simply following directions to connect points; they are checking whether a graph faithfully represents its source table. That makes these worksheets a practical Grade 4 resource for strengthening both graphing technique and data reasoning.