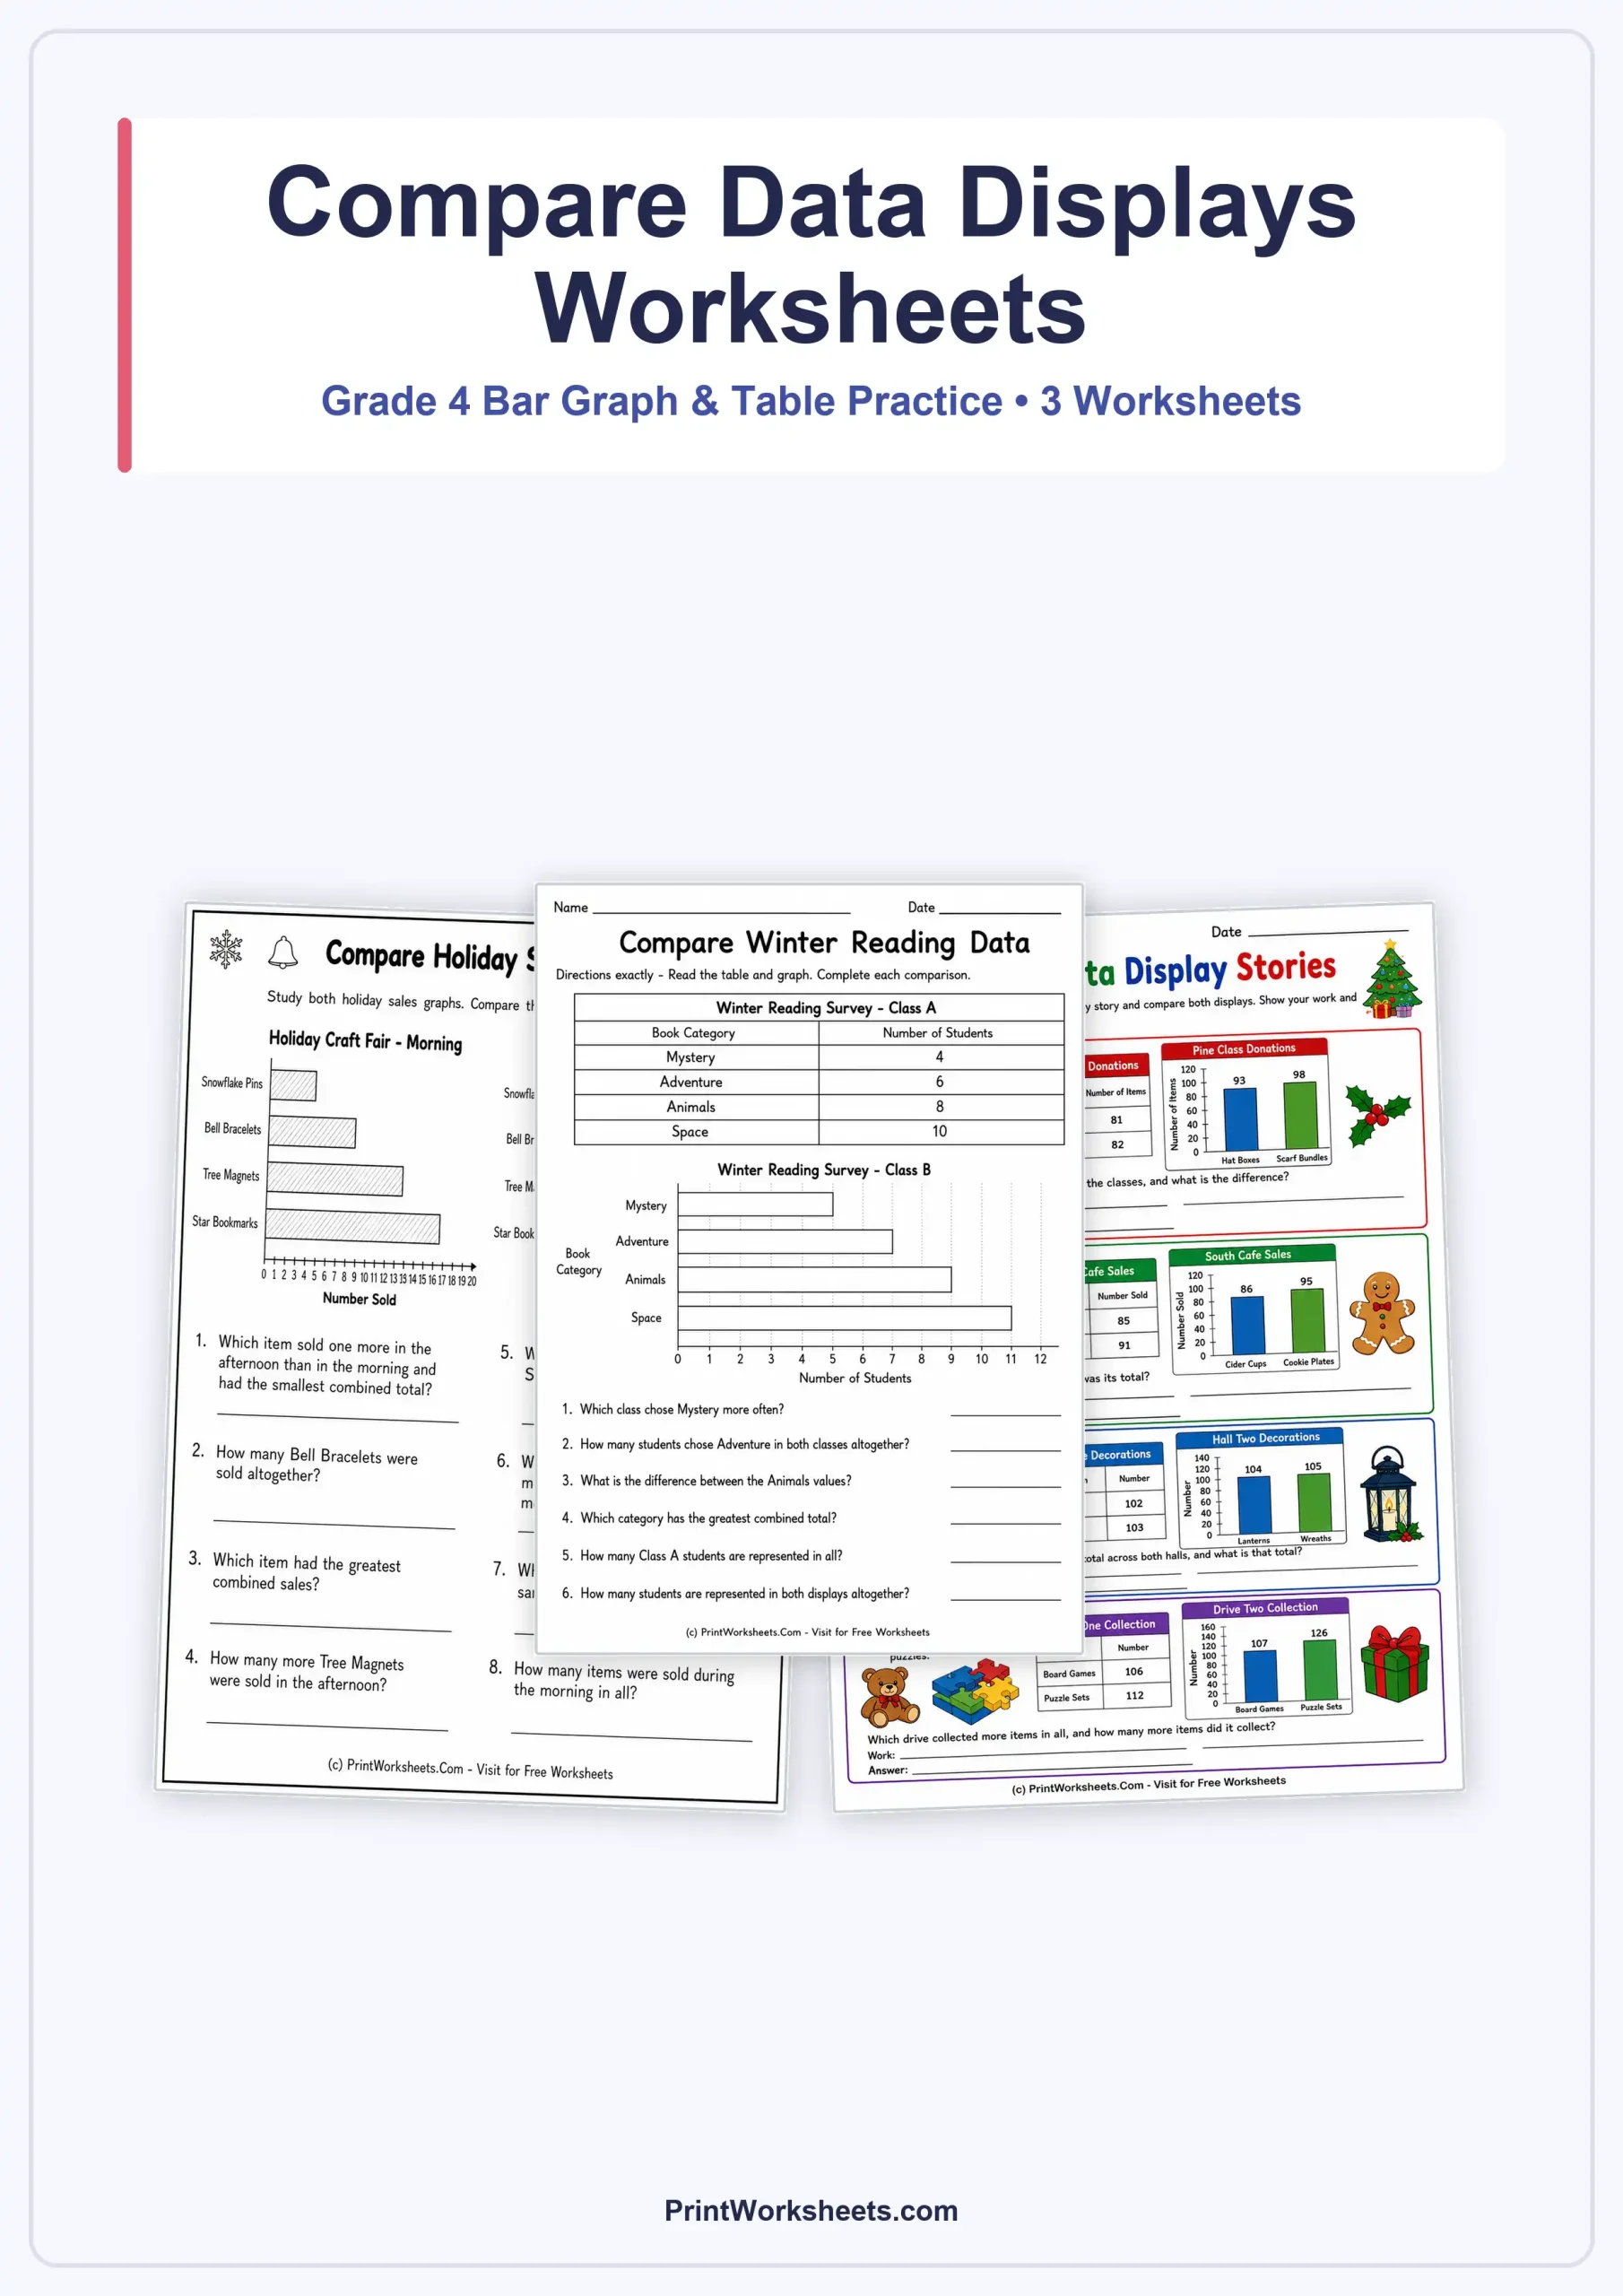
These compare data displays worksheets give Grade 4 students focused practice with reading two sources of information and deciding what the numbers show together. Instead of working from only one graph at a time, students compare morning and afternoon sales, match a data table with a bar graph, and solve story problems that require information from both displays. The set builds useful habits for checking labels, reading scales carefully, finding differences, and combining values before choosing or writing an answer.
Compare data displays worksheets with bar graphs and tables
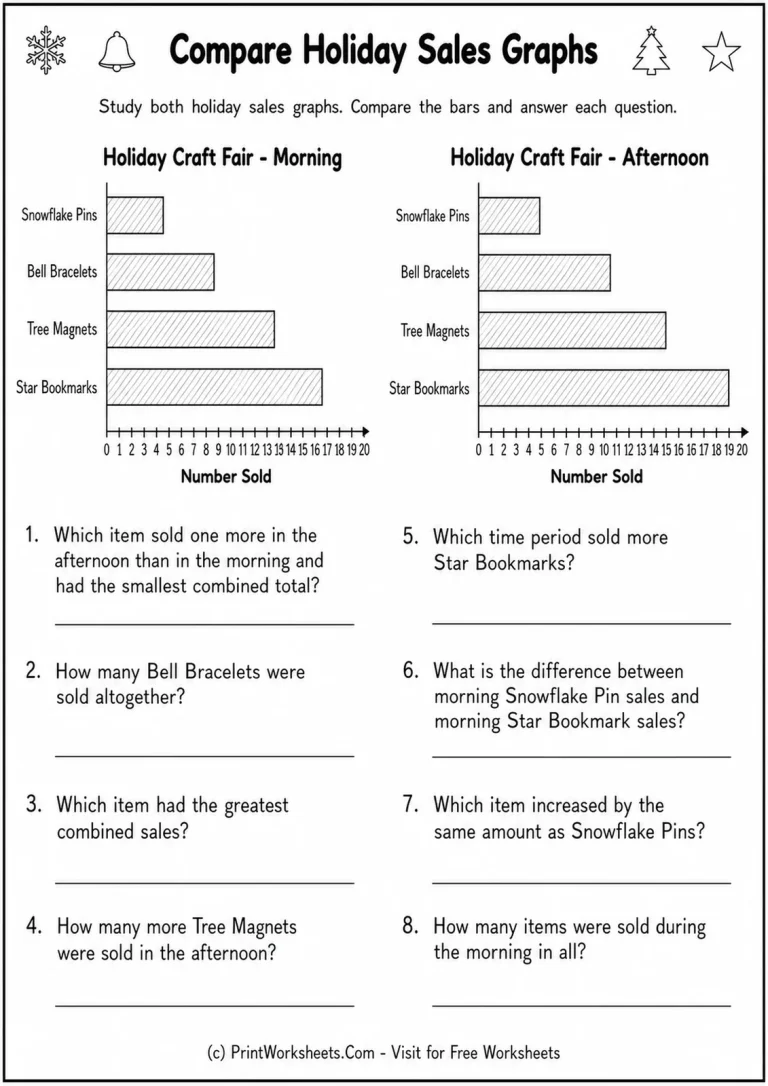
The first worksheet uses two horizontal bar graphs from a Holiday Craft Fair. Students compare morning and afternoon sales for Snowflake Pins, Bell Bracelets, Tree Magnets, and Star Bookmarks. The questions move beyond simple bar reading. Students identify an item that increased, find how many Bell Bracelets were sold altogether, determine which product had the greatest combined sales, compare Tree Magnet sales between time periods, and calculate the total number of items sold during the morning.
This format is especially useful because both graphs use the same categories and number scale. Students can place the two values for each item side by side mentally, then decide whether a question is asking for a difference, a total, or a direct comparison. That distinction is an important part of Grade 4 data work because the arithmetic is usually straightforward once the correct relationship between the values has been identified.
Practice comparing a table with a graph
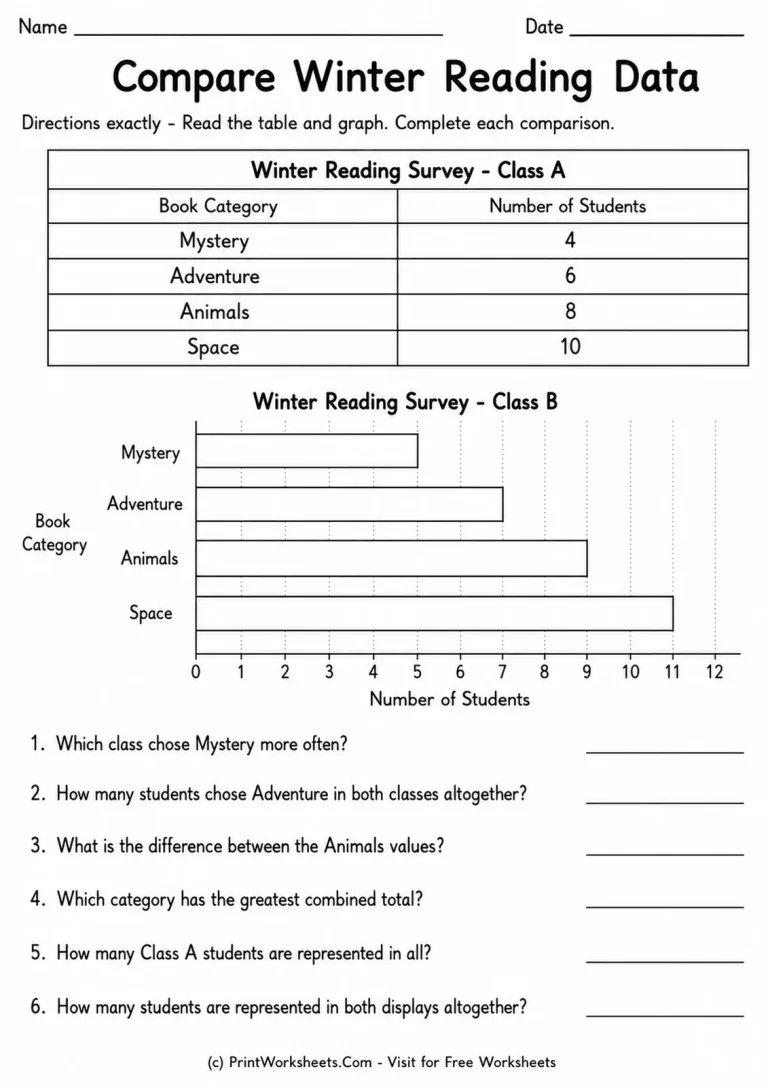
The second worksheet changes the representation instead of repeating the same layout. Class A’s Winter Reading Survey appears in a table, while Class B’s results appear in a horizontal bar graph. Both displays use the categories Mystery, Adventure, Animals, and Space. Students compare the classes, add Adventure choices from both groups, find the difference between the Animals values, identify the category with the greatest combined total, and calculate totals for one class and for both displays together.
Using two different display types helps students understand that the data matters more than the visual format. A value written in a table and a value represented by the end of a bar can still be compared directly when the category labels match. This worksheet also encourages students to move back and forth between displays instead of finishing one source and ignoring the other.
From direct comparisons to data stories
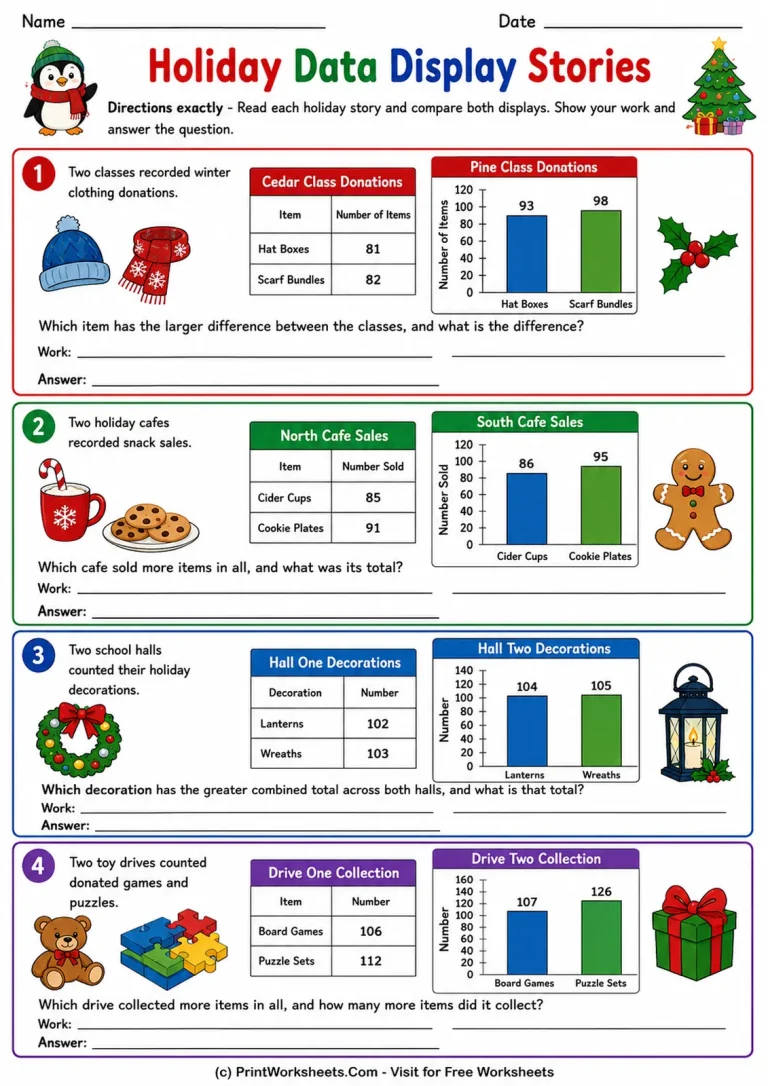
The third printable page places the same skill inside four holiday-themed situations. Students compare winter clothing donations from two classes, snack sales from two cafes, decoration counts from two school halls, and donated games and puzzles from two toy drives. Each problem pairs a small table with a bar graph and asks students to show their work before answering.
The questions include several types of reasoning. Students compare the difference for two clothing items, find the total sales for a cafe, combine matching decoration categories across two halls, and compare overall totals for two donation drives. The values extend into the hundreds, so students must organize information carefully rather than relying only on visual estimation. The repeated table-and-graph pairing also makes the page useful for checking whether students can transfer the skill to new contexts.
Skills students use across the worksheet set
Across the three pages, students practice reading category labels and number scales, locating matching categories in two displays, adding values from separate sources, subtracting to find differences, identifying greater totals, and interpreting comparison language such as more, altogether, difference, increased, and combined. The worksheets therefore support both graph-reading fluency and the mathematical language students need for data word problems.
Teachers can use the pages in sequence for a short data-comparison lesson, assign one page for independent practice, or use the story problems after students are comfortable reading graphs and tables separately. Parents can also use the set for extra practice because the questions are self-contained and the familiar seasonal contexts make the data easy to discuss aloud. Asking a student to point to the two values used in each calculation is a simple way to reinforce careful evidence-based reasoning.
A practical Grade 4 data review
This worksheet set is a strong fit for review before more advanced graphing and data analysis. Students are not just reading isolated numbers; they are deciding which two values belong together and what operation the question requires. With parallel bar graphs, mixed table-and-graph comparisons, and multi-step story situations, the pages provide varied practice while staying centered on one clear Grade 4 skill: comparing two data displays accurately.