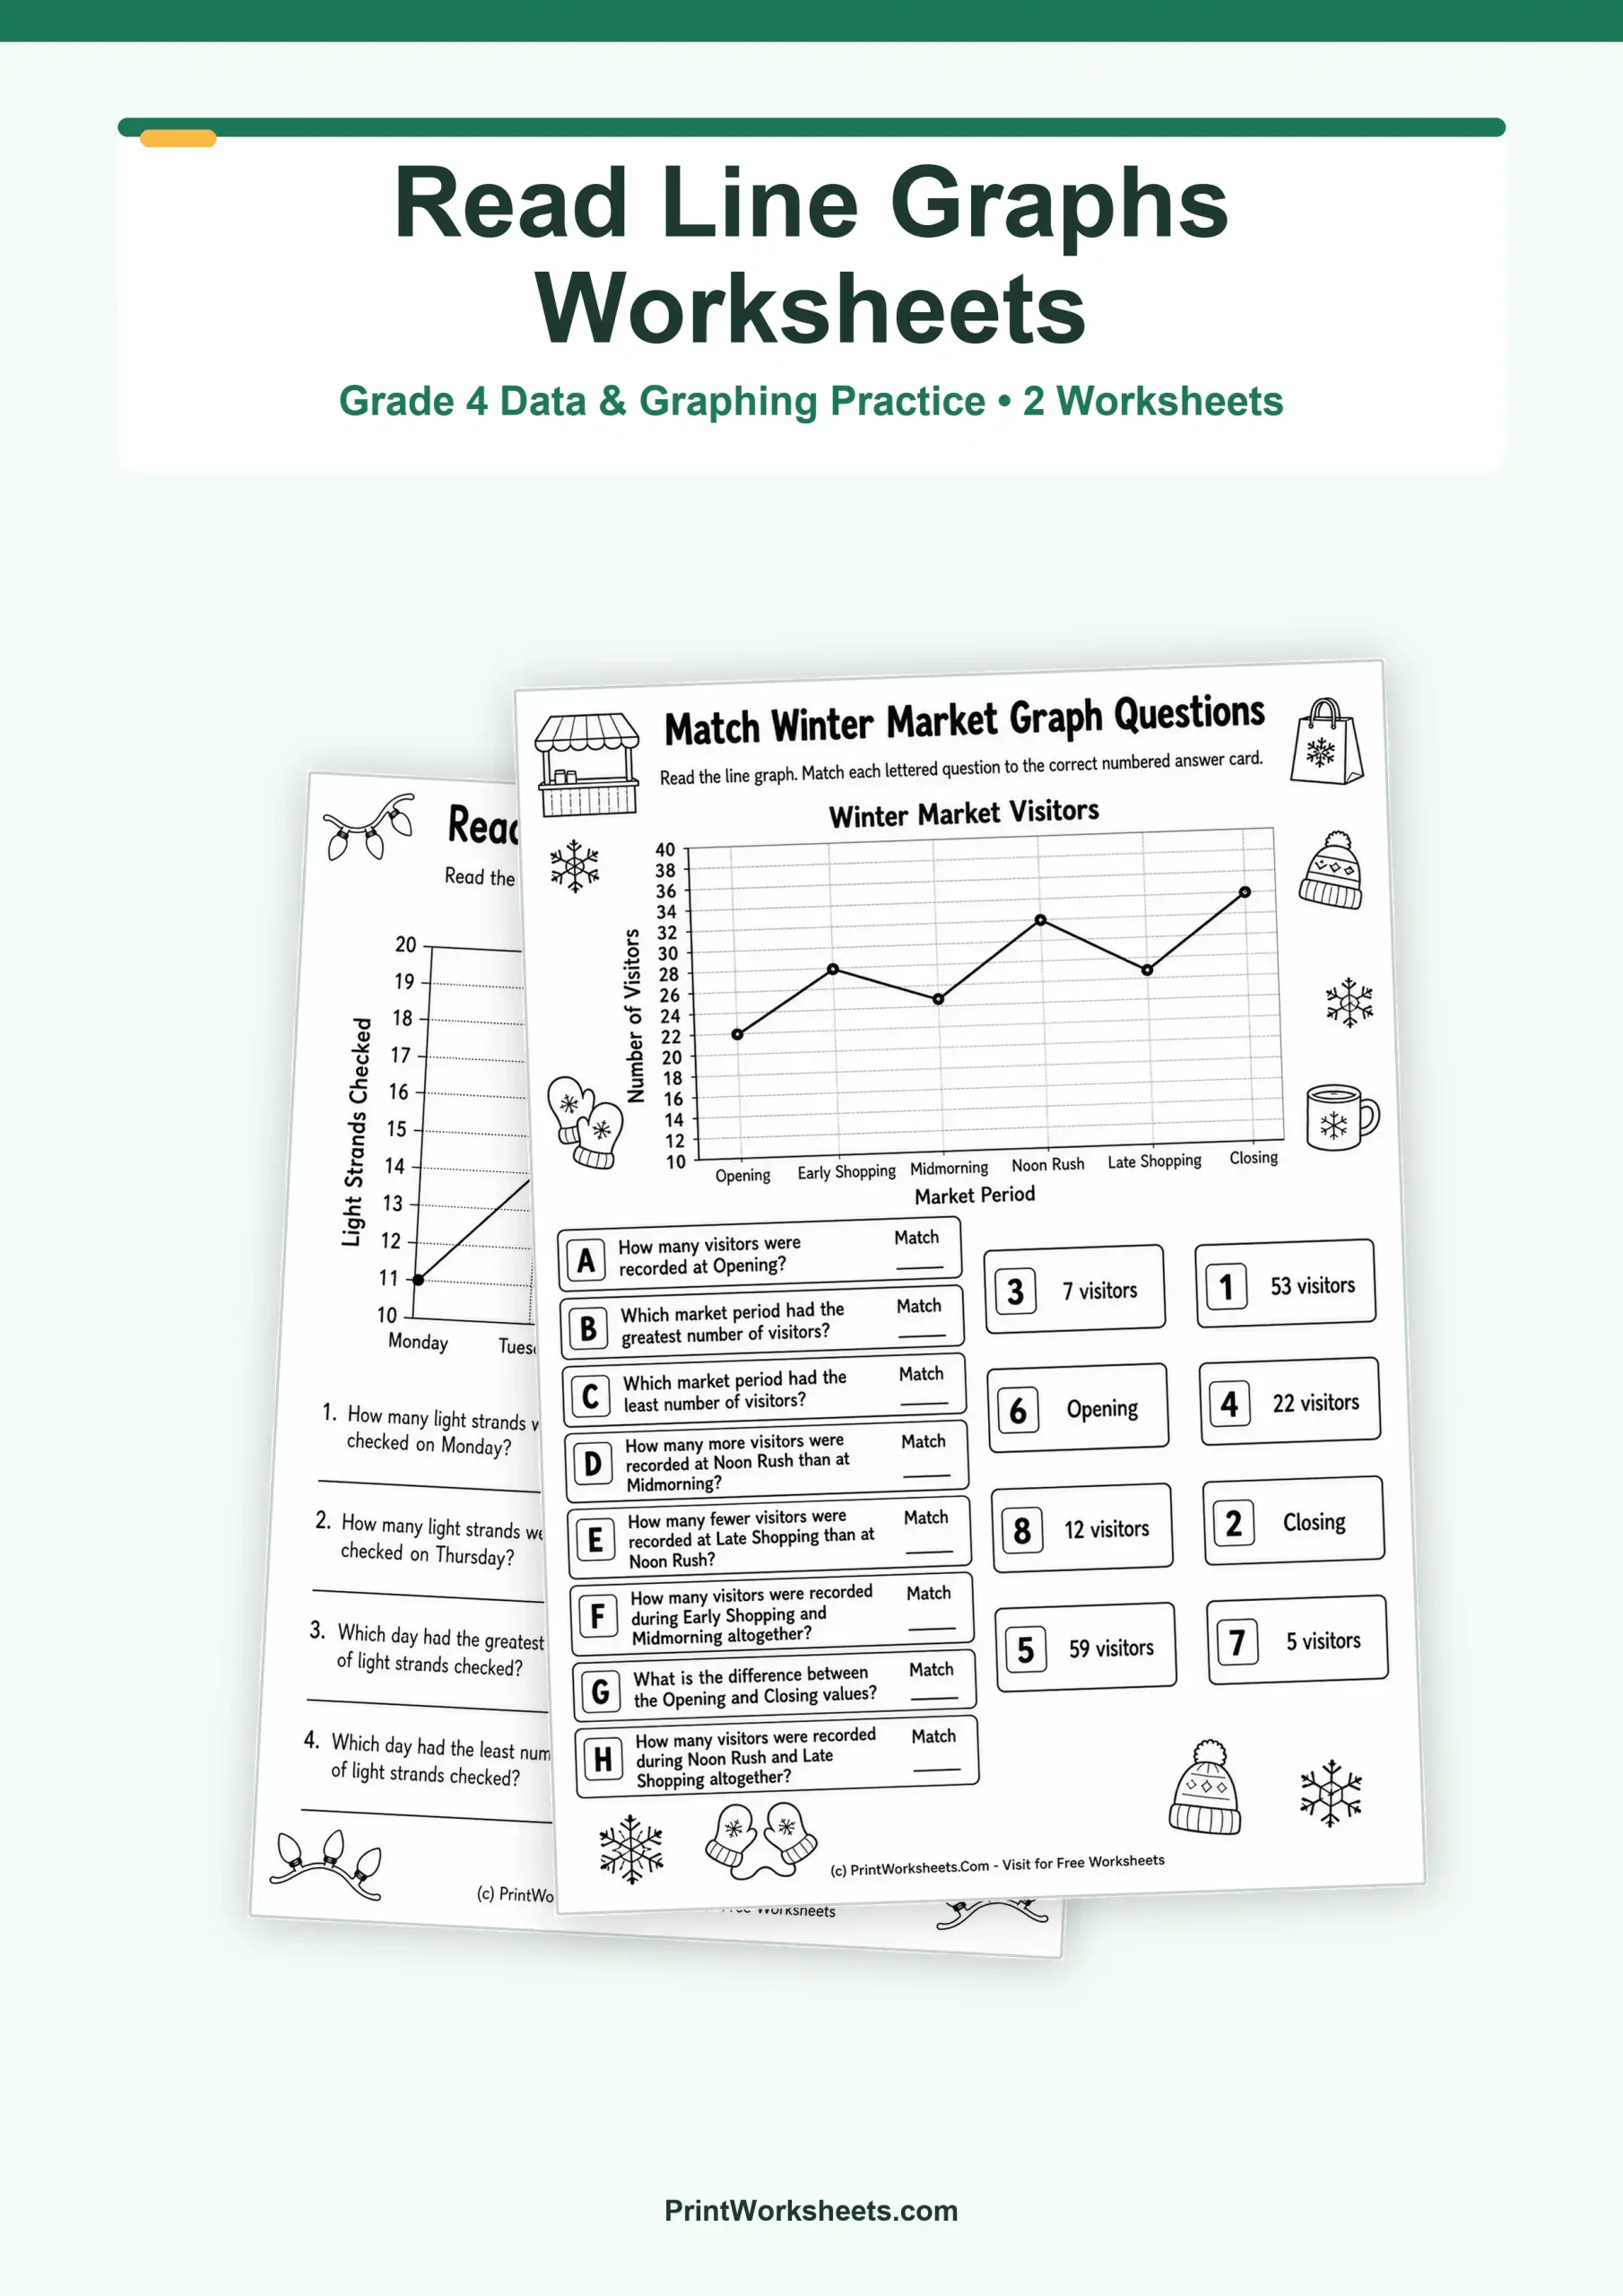
These read line graphs worksheets give fourth-grade students focused practice turning plotted points into useful numerical information. Instead of asking students to draw a graph from scratch, both pages begin with a completed line graph and require careful reading of the axes, labels, scale, and changing data values. The first worksheet uses a Holiday Lights Checked graph with Monday through Saturday data, while the second uses a Winter Market Visitors graph across different parts of a shopping day. Together, the pages move beyond simple point reading by asking students to identify greatest and least values, compare two data points, calculate differences, and combine values.
Read Line Graphs and Answer Data Questions
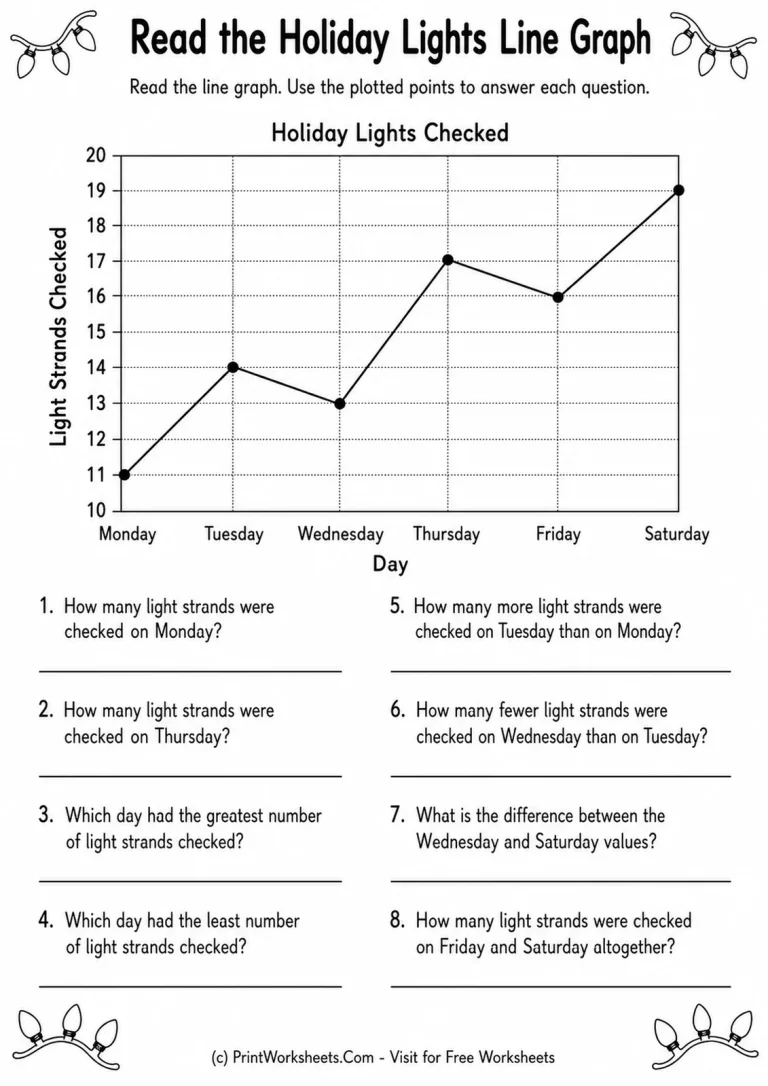
The Holiday Lights worksheet is built around a six-day line graph showing the number of light strands checked each day. Students first need to locate individual days on the horizontal axis and connect each day with its plotted value. The daily values stay within a compact range, so students must pay attention to the graph rather than relying on obvious visual gaps.
The questions then use those values in several ways. Some ask for a direct reading from one day, while others ask which day has the greatest or least number of checked light strands. Students also compare neighboring days, including finding the difference between Tuesday and Monday and between Wednesday and Tuesday. A later item asks students to combine the Friday and Saturday values, connecting graph interpretation with addition practice.
This mix is useful because reading a line graph is not only about naming the height of a point. Students also need to understand what the values mean when two points are compared. Teachers working on broader data representation skills can pair this practice with bar graphs from tables to contrast reading an already displayed data set with constructing a different type of graph from organized information.
Grade 4 Line Graph Interpretation with Matching
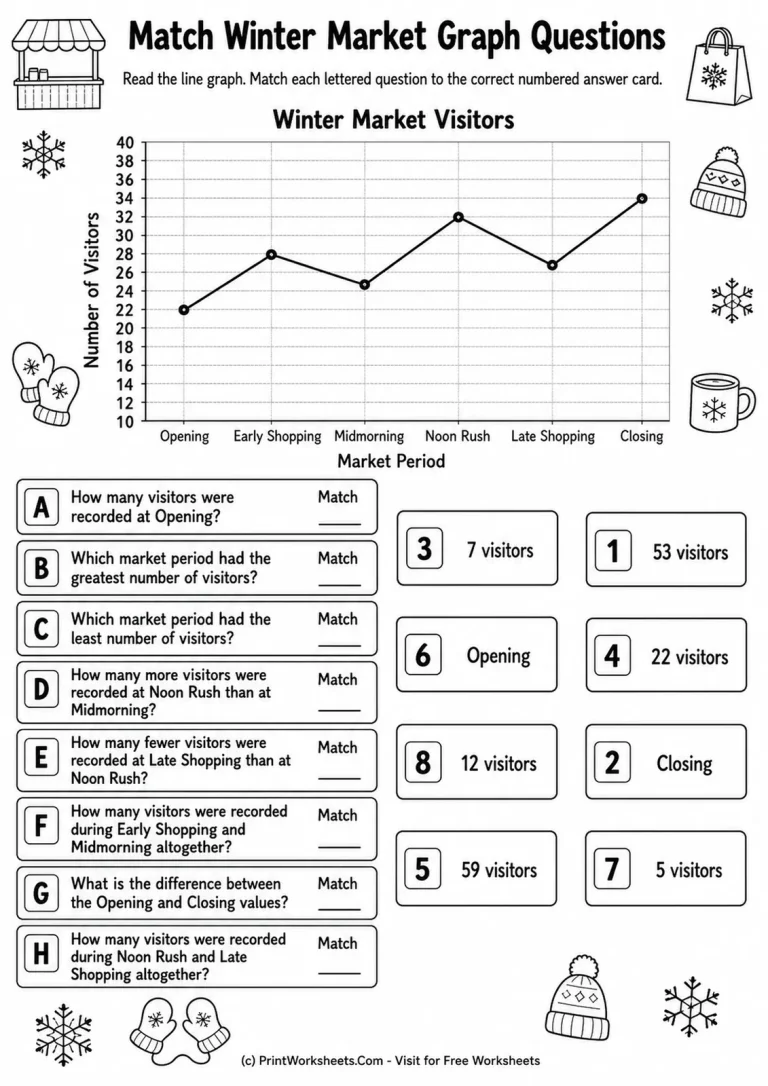
The second worksheet changes both the context and the response format. The Winter Market Visitors graph follows visitor counts through Opening, Early Shopping, Midmorning, Noon Rush, Late Shopping, and Closing. Students read the plotted visitor totals and then match questions labeled A-H with numbered answer cards.
This matching structure adds an extra reasoning step. Students cannot simply write the first number they see. They need to solve each question, then locate the corresponding answer among several choices. The prompts include direct value reading as well as identifying the busiest or quietest period, comparing visitor counts, finding differences, and combining data from two time periods. That makes the page suitable for independent work, partner checking, or a short review after line graphs have been introduced.
Students who have previously worked with simpler visual displays may also benefit from revisiting picture graph worksheets. Picture graphs emphasize counting and comparison, while these Grade 4 line graph activities require students to track changing numerical values across an ordered sequence.
Skills Practiced on These Line Graph Worksheets
Across the two printable pages, students practice locating categories on the horizontal axis, reading numerical values from the vertical scale, identifying maximum and minimum data points, comparing two plotted values, subtracting to find a difference, and adding values from separate points. The contexts are familiar enough that students can concentrate on the mathematical relationships rather than learning specialized vocabulary.
The pages can be used in several ways. A teacher might assign the Holiday Lights page first because its short-answer format makes student reasoning easy to inspect. The Winter Market page can follow as a second practice activity because the matching format asks students to verify each calculated answer against a set of possibilities. Parents can also use one page for guided practice and keep the other for independent review.
Extending Line Graph Skills
After students are comfortable reading these whole-number line graphs, a natural next challenge is interpreting graphs with more demanding number types. The line graphs with decimal data set extends the same general graph-reading habits into Grade 5 work with decimal values.
These Grade 4 worksheets are especially useful when the goal is to check whether students can extract accurate information from a line graph and then use that information in calculations. Because the two pages use different scenarios and response formats, they provide repeated practice without simply repeating the same exercise layout.