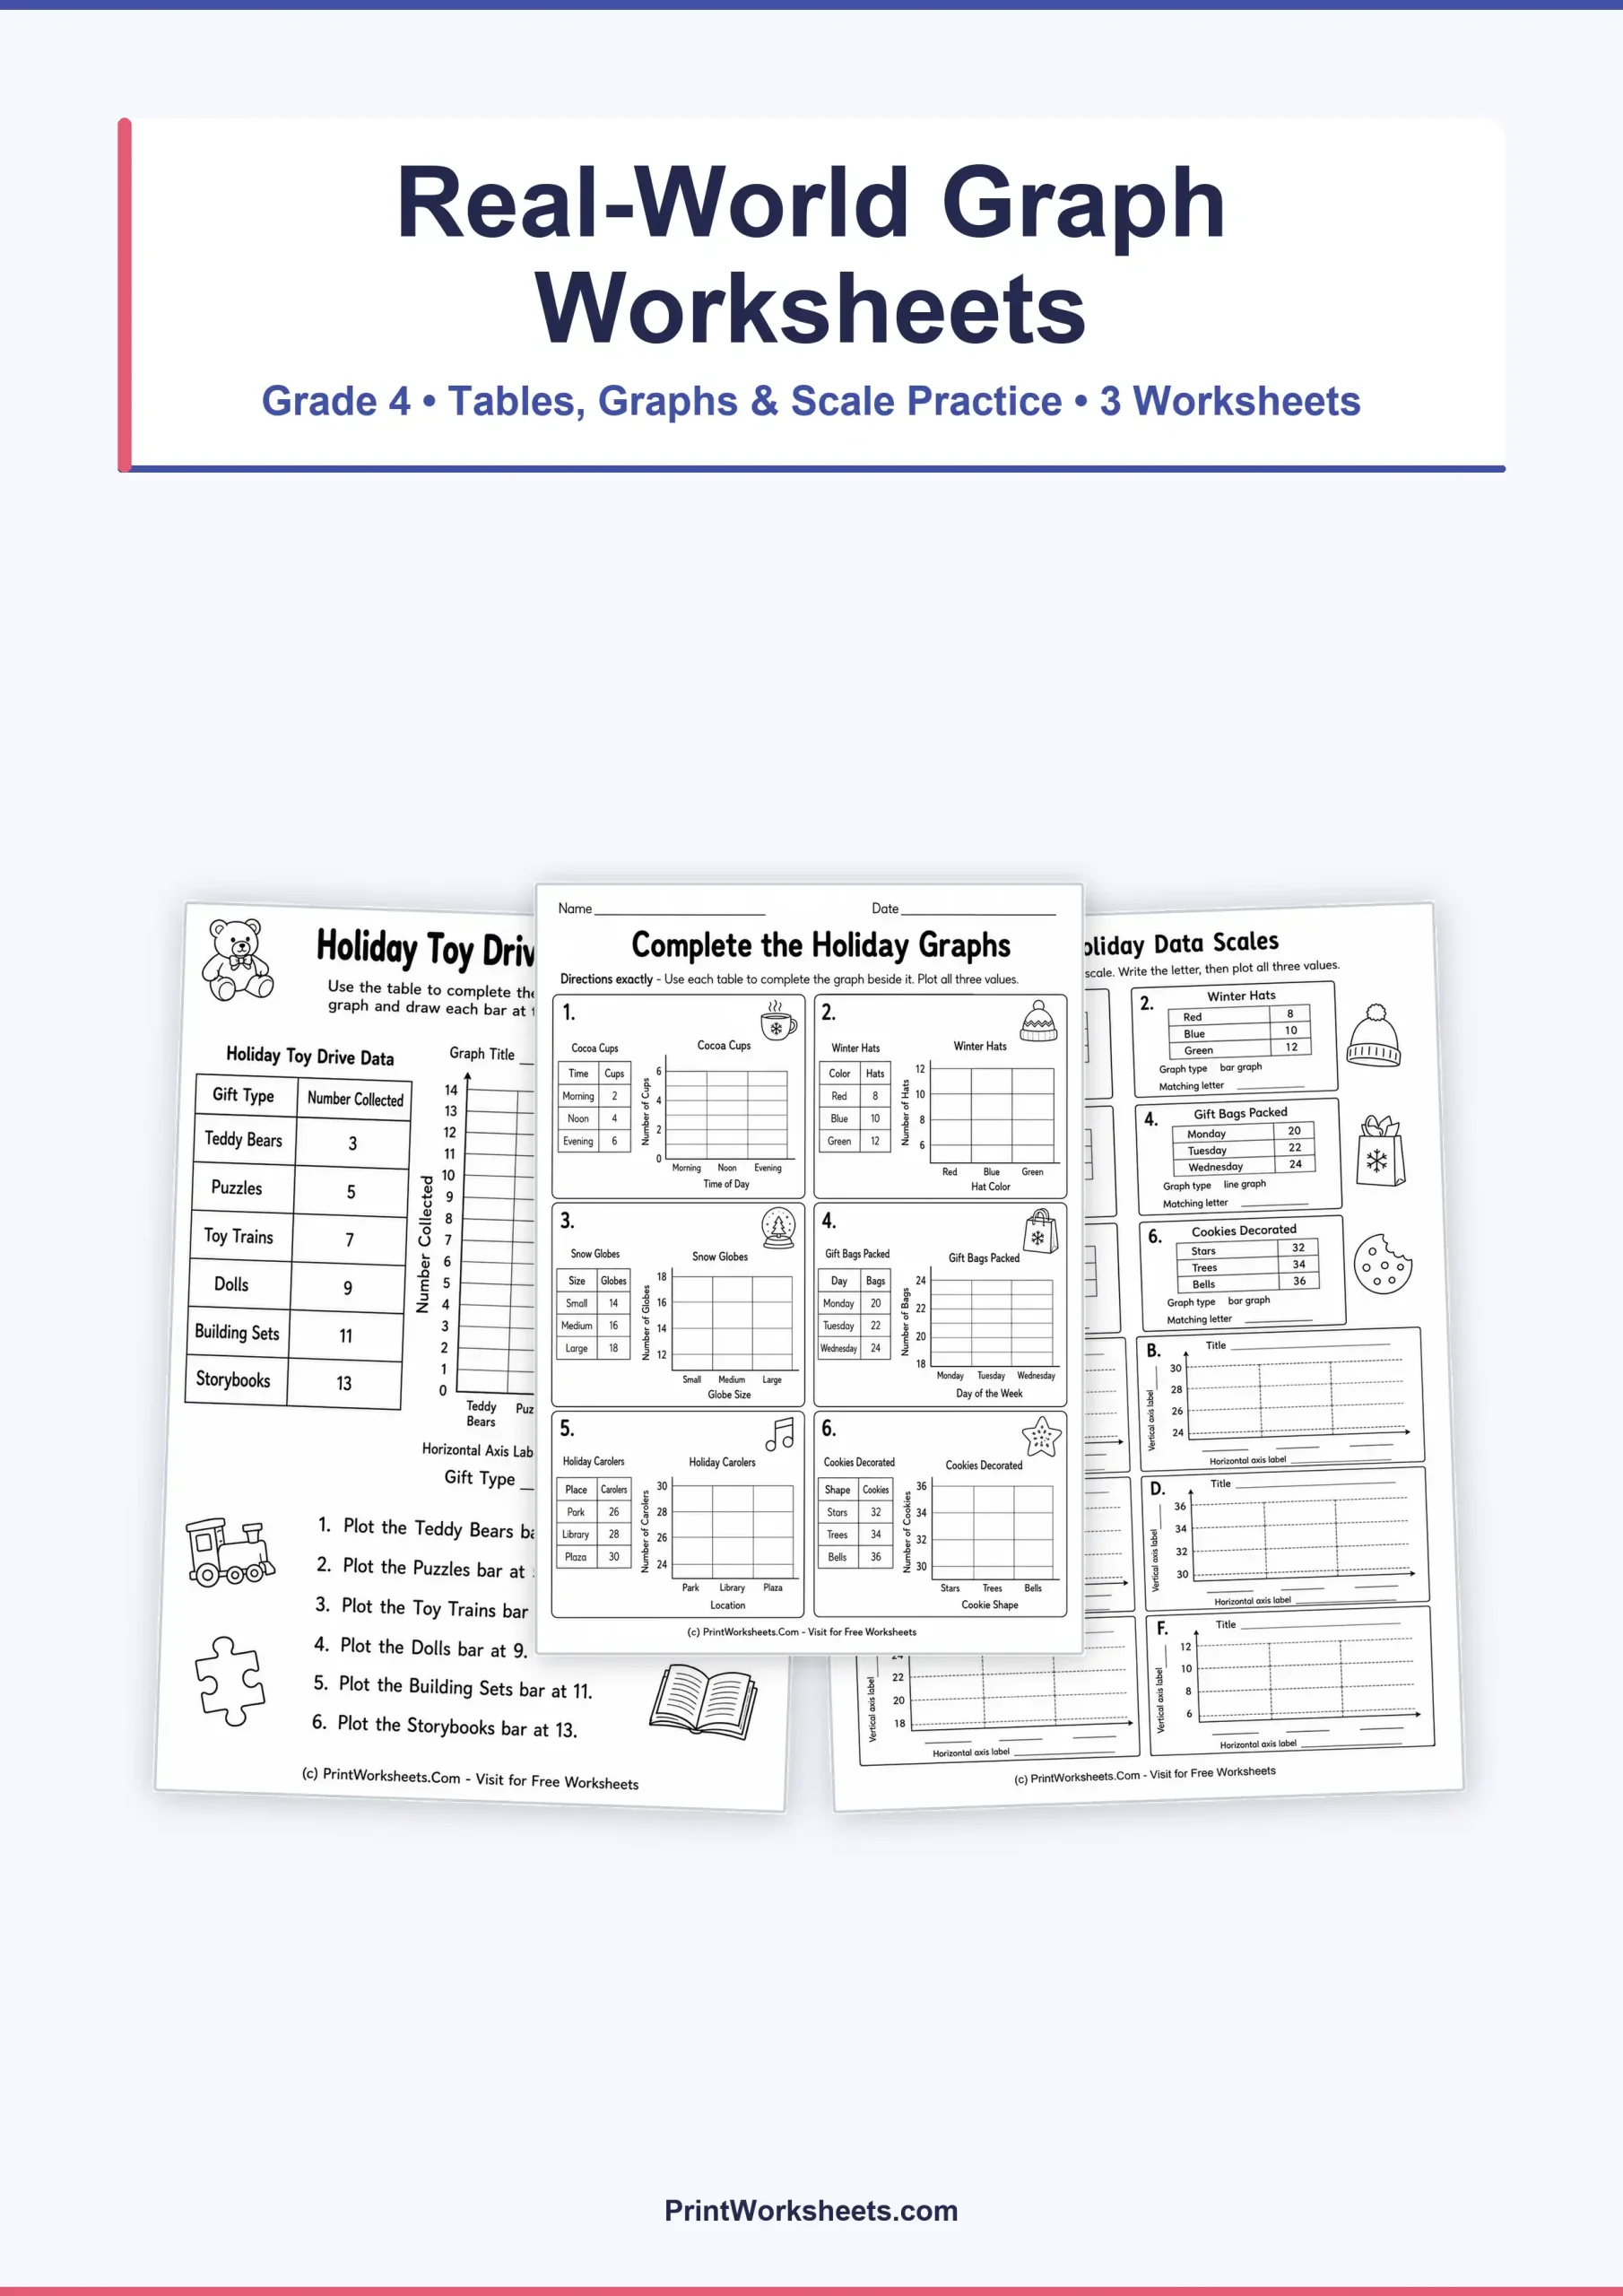
These real-world graph worksheets give Grade 4 students a practical reason to turn numbers into visual displays. Instead of starting with a finished graph and answering questions about it, students work from small tables of holiday-themed data and decide how those values should appear on a graph. Across the three worksheets, the work develops from drawing one complete bar graph to handling several short data sets and then choosing a graph scale that fits the values before plotting them.
Real-World Graph Worksheets with Meaningful Data
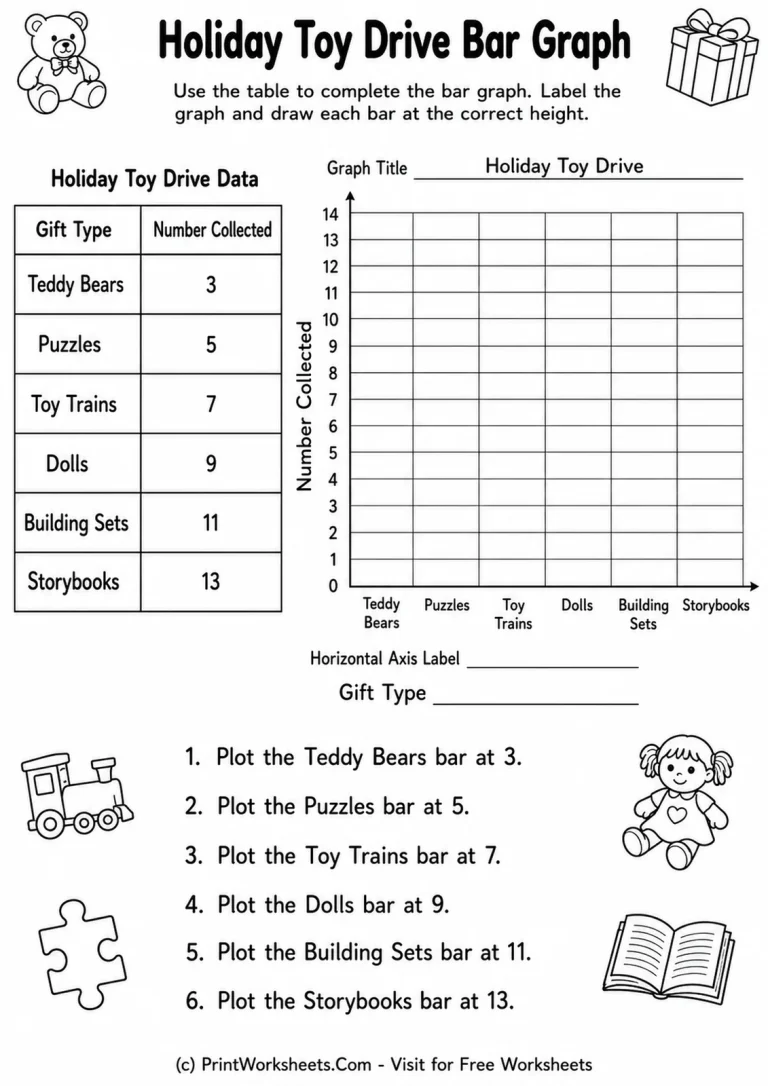
The first worksheet, Holiday Toy Drive Bar Graph, provides a clear entry point into graph creation. Students use a six-category table containing Teddy Bears, Puzzles, Toy Trains, Dolls, Building Sets, and Storybooks. The values are 3, 5, 7, 9, 11, and 13, and the blank bar graph uses a vertical scale from 0 to 14 in increments of one. Students must transfer each table value to the correct category, draw every bar to the proper height, and label the graph. Because the scale is already supplied, attention stays on accurate placement and the relationship between a table entry and its visual representation.
This format is useful when students understand how to read a bar graph but still need practice constructing one themselves. The evenly spaced scale also makes small errors easy to notice. A bar that reaches 10 instead of 11, for example, shows immediately whether a student is tracking the numerical scale carefully.
From One Graph to Several Short Data Sets
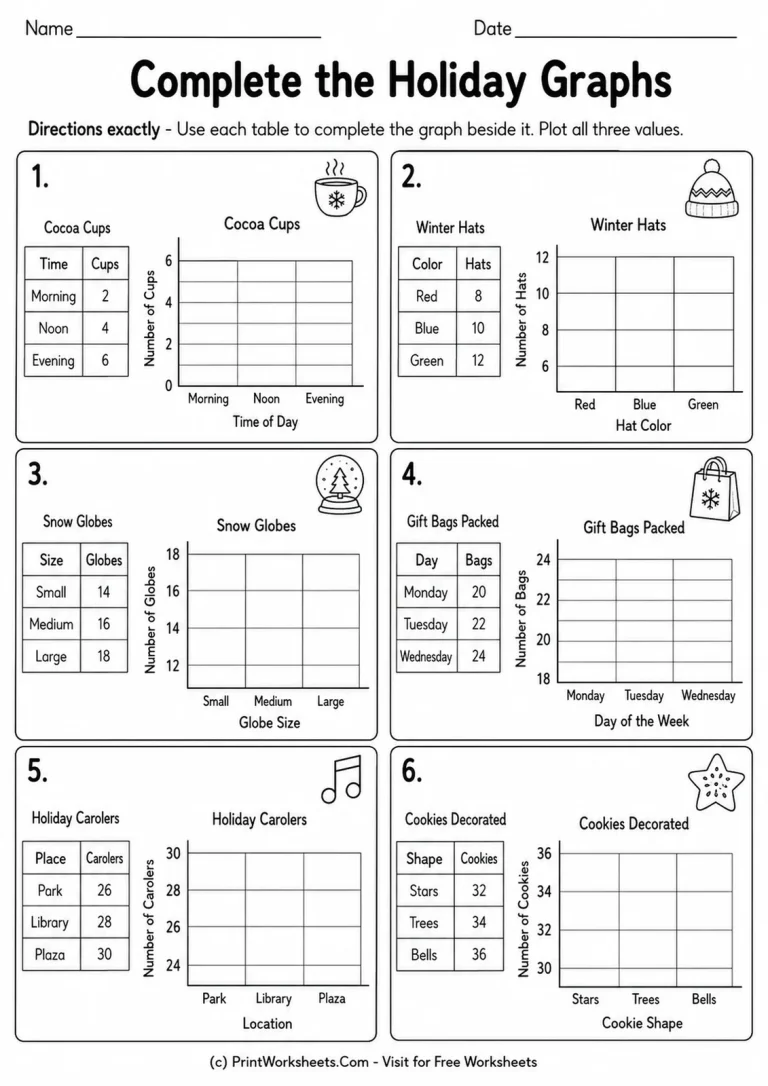
The second worksheet, Complete the Holiday Graphs, increases the amount of independent graphing without making any single data set overwhelming. Six small real-life themed tables appear with corresponding blank graph areas. The topics include Cocoa Cups, Winter Hats, Snow Globes, Gift Bags Packed, Holiday Carolers, and Cookies Decorated. Each table contains three values, so students repeatedly practice locating categories, checking the numerical range, and plotting the data.
The changing values make the repeated practice more purposeful. Cocoa Cups uses Morning 2, Noon 4, and Evening 6. Winter Hats uses Red 8, Blue 10, and Green 12. Snow Globes moves higher with Small 14, Medium 16, and Large 18, while Gift Bags Packed uses Monday 20, Tuesday 22, and Wednesday 24. Students therefore cannot rely on one memorized scale or one familiar range. They must look at the labels and numbers in each mini-table before completing the nearby graph.
Choosing a Graph Scale Before Plotting
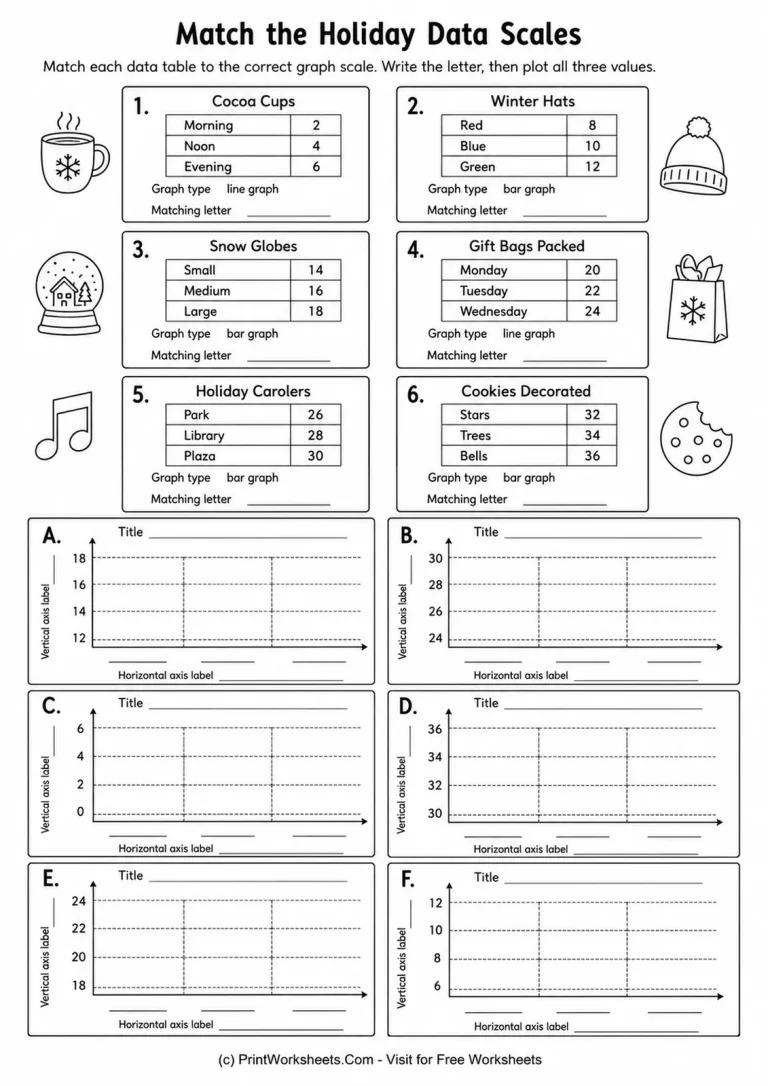
The third worksheet adds a reasoning step that distinguishes this set from basic table-to-graph practice. In Match the Holiday Data Scales, students examine six holiday-themed data tables and match each one to the correct graph frame labeled A through F. The tables also identify whether the display should be a line graph or a bar graph. Students first decide which scale can represent the data correctly, record the matching letter, and then plot the three values on the selected frame.
This task helps students see that graph construction is not only about drawing bars or points. A useful graph also needs a scale that can accommodate the data range and show the values clearly. Requiring the scale choice before plotting encourages students to inspect maximum values, intervals, category labels, and graph type rather than beginning mechanically.
Ways to Use the Three-Worksheet Progression
The worksheets can be used in sequence during a data and graphing unit. Begin with the toy drive page when students need a structured example with a fixed one-unit scale. Move to the six mini-graphs when they are ready for repeated practice across different numerical ranges. Use the scale-matching page after students have experience plotting values and are prepared to make a decision about which graph framework is appropriate.
Teachers can also separate the pages by purpose. The first works well for guided practice, the second for independent classwork or a math center, and the third for checking whether students understand the relationship between a data set and an appropriate graph scale. Parents using the worksheets at home can ask students to explain why a particular scale fits a table before any points or bars are drawn. That short explanation reveals whether the student is reasoning from the data rather than guessing.
By combining familiar real-world contexts with increasingly independent graph-building decisions, this Grade 4 set gives students repeated practice turning tables into useful visual displays. The progression keeps the focus on accurate plotting while gradually adding the important skill of selecting a scale that matches the data.